DATASCI 350 - Data Science Computing
Lecture 19 - Working with APIs in Practice
Hello! Great to see you again! 😊
Brief recap 📚
Where we got to last class
Web APIs without writing code
- An API is a contract: ask this way, get that back
- A URL has a host, a path (what you want), and a query string (how you want it)
- A status code says how it went:
2xxworked,4xxis your mistake,5xxis theirs - The World Bank answers some errors with
200, so look at the data too - JSON is made of objects
{ }and arrays[ ] - A value is reached by a path, such as
current→temperature_2m curl -osaved a reply to a file- Four lines of Python did the same as
curl
Today we do it all in Python
- Read JSON from a file
- Follow a path with square brackets
- Send requests and check for errors
- Turn the reply into a DataFrame
- Save it for your report
- Read your project’s pull script, line by line
Lecture overview
What we will cover today
1. Reading JSON in Python
- Dictionaries and lists
- Opening a file
- From a path to square brackets
2. requests, step by step
- What comes back from
requests.get - Letting
requestsbuild the URL - Checking for errors
3. From JSON to a DataFrame
- A loop that picks the fields you want
- Many countries in one request
- Missing values, and saving to CSV
4. Your project’s pull script
pull_data.py, part by part- What to do if your API needs a key or sends pages
Reading JSON in Python 🐍
Dictionaries and lists
The two Python types that hold JSON
- A dictionary (
dict) is Python’s JSON object:{"key": value} - You get a value by its key:
course["code"] - A list is Python’s JSON array:
[a, b, c] - You get a value by its position, from 0:
years[0] - A dictionary can hold another dictionary. Each step of the path adds one pair of brackets
course["instructor"]["name"]is the pathinstructor→namefrom last class
Opening a file
What with open(...) as f: means
The file is last class’s curl -o download: wb_gdp_bra.json. Save it in a data/ folder next to your notebook
open("data/wb_gdp_bra.json")finds the file and prepares it for readingas fgives the open file a short name,f- The indented lines run while the file is open
- When they finish, Python closes the file for you
json.load(f)reads the JSON text and turns it into Python objects- The World Bank reply is a list of two items, as we saw last class
json.load and json.loads
One reads a file, the other reads a string
json.load(f)reads JSON from an open filejson.loads(text)reads JSON from a string. Thesstands for “string”- Before: one long piece of text. After: a dictionary you can index
- JSON
falsebecame PythonFalse - Later today,
r.json()does the same for an API reply
From a path to square brackets
The World Bank reply, one step per line
wb[0]is the metadata, andwb[1]is the list of records- Giving each step a name, like
metaandrecords, makes the code easy to read records[0]is the newest year, 2025first["country"]["value"]is the pathcountry→value- You could write
wb[1][0]["country"]["value"]in one go. It is the same path
When a path is wrong
Two errors you will see, and what to do about them
- A
KeyErrormeans the dictionary has no such key - Here the key is called
date, notyear
- An
IndexErrormeans the list is shorter than you think wbhas two items, at positions 0 and 1
Try it yourself! 🤓
Five minutes, with the Uruguay file
- Use the Uruguay file you saved with
curllast class, or downloadwb_pop_ury.json - Open it with
with open(...) as f:andjson.load(f) - Print the total number of records from the metadata
- Print the year and population for 2020. You wrote this path last class
- Print the country name
What to look for
- 12 records
- A population of 3,398,968 in 2020
- The name “Uruguay”
Stuck, or want to compare your code with mine?
requests, step by step 🌐
What comes back from requests.get
A response object, with the reply inside
requests.getreturns a response, which we callrr.status_codeis the status coder.textis the reply as plain text.[:60]shows the first 60 charactersr.json()turns that text into a dictionary, likejson.loadstimeout=30gives up after 30 seconds. Without it, a silent server can make your script wait forever- Install
requestsonce withpip install requests
Let requests build the URL
Put the options in a dictionary called params
- The
urlholds only the path. No?and no& - Each key in
paramsbecomes one option in the query string requestsadds the?and the&for you- It also percent-encodes the values:
:became%3A r.urlshows the full URL that was sent. Paste it into your browser to check it- To change the years, you change one value, not a long string
Checking for errors
raise_for_status() stops the script on a bad status
A typo in the path: countryy instead of country
r.raise_for_status()checks the status code- If it is
4xxor5xx, it raises an error: Python stops and prints a message - If the status is
2xx, it does nothing and the script carries on - Stopping early is good. You see the problem where it happens, not ten lines later
- Put it right after every
requests.get
The World Bank’s hidden error
A 200 that carries an error message
A country code that does not exist, XYZ:
- The status is
200, soraise_for_status()lets it pass - A good World Bank reply has two items: metadata and data
- This one has only one, holding an error message
if len(payload) < 2:catches it- The status tells you the request arrived. The data tells you whether it worked
A complete request
Ask, check, and save
import json
import requests

url = "https://api.worldbank.org/v2/country/BRA/indicator/NY.GDP.PCAP.KD"
params = {"format": "json", "date": "2014:2025"}

r = requests.get(url, params=params, timeout=30)
r.raise_for_status()
payload = r.json()

if len(payload) < 2:
    print("No data:", payload)
else:
    with open("data/wb_gdp_bra.json", "w") as f:
        json.dump(payload, f, indent=2)
print("Saved", payload[0]["total"], "records")- This is the Python version of last class’s
curl -o open(..., "w")opens the file for writing. It creates the file, or replaces itjson.dumpis the reverse ofjson.load: it turns Python objects into JSON text in a fileindent=2makes the file readable, likejson.tool- The
else:block runs only when the check passes, so a bad reply is never saved
Try it yourself! 🤓
Ten minutes, in Python
- Copy the code from the previous slide
- Change it to fetch Uruguay’s population, 2014 to 2025
- Country
URY, indicatorSP.POP.TOTL
- Country
- Save the reply to
data/wb_pop_ury.json - Print
r.url, and paste it into your browser - Print the number of records
- Bonus: change the country to
XYZ. What does your script print?
What to look for
- Only two things change: the country and the indicator
- A URL that ends in
?format=json&date=2014%3A2025 - 12 records saved
- With
XYZ, the “No data” message, and no file saved
Stuck, or want to compare your code with mine?
From JSON to a DataFrame 🐼
A loop that picks the fields
One small dictionary per record
- Each World Bank record has eight fields, some nested. We want three
rows = []starts an empty listfor record in records:runs the indented lines once per record- Each time, we build a small dictionary with the three fields we want
rows.append(row)adds it to the end of the listint(record["date"])turns the year from text,"2025", into a number,2025
From a list of dictionaries to a DataFrame
Each dictionary becomes a row
pd.DataFrame(rows)makes one row per dictionary- The keys,
country,yearandvalue, become the column names sort_values("year")puts the oldest year firstreset_index(drop=True)renumbers the rows from 0 after sortingdf.shapeis (rows, columns): 12 years, 3 columns- From here on, it is ordinary pandas
A shortcut: pd.json_normalize
It flattens every field for you
json_normalizekeeps all the fields, ten columns here- A nested field gets a name with a dot:
country→valuebecomescountry.value - You then choose the columns you want with double brackets
dateis still text here. The loop turned it into a number- Both ways work. The loop is longer, but you see every step
Many countries in one request
Join the country codes with ;
Life expectancy for five countries, 2000 to 2024
Then the same loop and pd.DataFrame(rows):
BRA;IND;JPN;NGA;USAasks for five countries at onceSP.DYN.LE00.INis life expectancy at birth- 5 countries × 25 years = 125 records
- The World Bank sends 50 records per page by default
per_page=1000gets them all in one reply, so there is only one page to read- Saved reply:
wb_life_expectancy_5.json
Missing values
Some years have no data yet
The same loop, with BRA;NGA and the years 2022:2025
- The World Bank has not published 2025 life expectancy yet
- It sends those years with
"value": null - JSON
nullbecomes PythonNone, and pandas shows it asNaN(“not a number”) dropna()removes the rows with missing values- A missing value is not a zero. Say in your report how you handled it
A first analysis, and saving the table
Back to the five-country table
The CSV starts like this:
df[df["year"] == 2024]keeps only the rows for 2024ascending=Falseputs the highest value first- The numbers on the left are the original row labels
to_csvwrites the table to a file your report can readindex=Falseleaves out those row labels, which are not data- Parquet is a smaller, faster format. Lecture 21 covers it
Try it yourself! 🤓
Ten minutes, from request to table
- Fetch GDP per capita (
NY.GDP.PCAP.KD) for Argentina, Brazil, and Uruguay (ARG;BRA;URY), 2014 to 2025 - Check the reply with
raise_for_status()and the length check - Build a DataFrame with the loop from today:
country,year,value - Print its shape, and count the missing values with
df["value"].isna().sum() - Which country had the highest GDP per capita in 2025?
- Save the table to
data/gdp_south_america.csv
What to look for
- 36 rows: 3 countries × 12 years
- No missing values in this series
- Uruguay first, then Argentina, then Brazil
Stuck, or want to compare your code with mine?
Your project’s pull script 🗺️
Today’s lecture is your project’s first step
Four stages, and you now have the first two
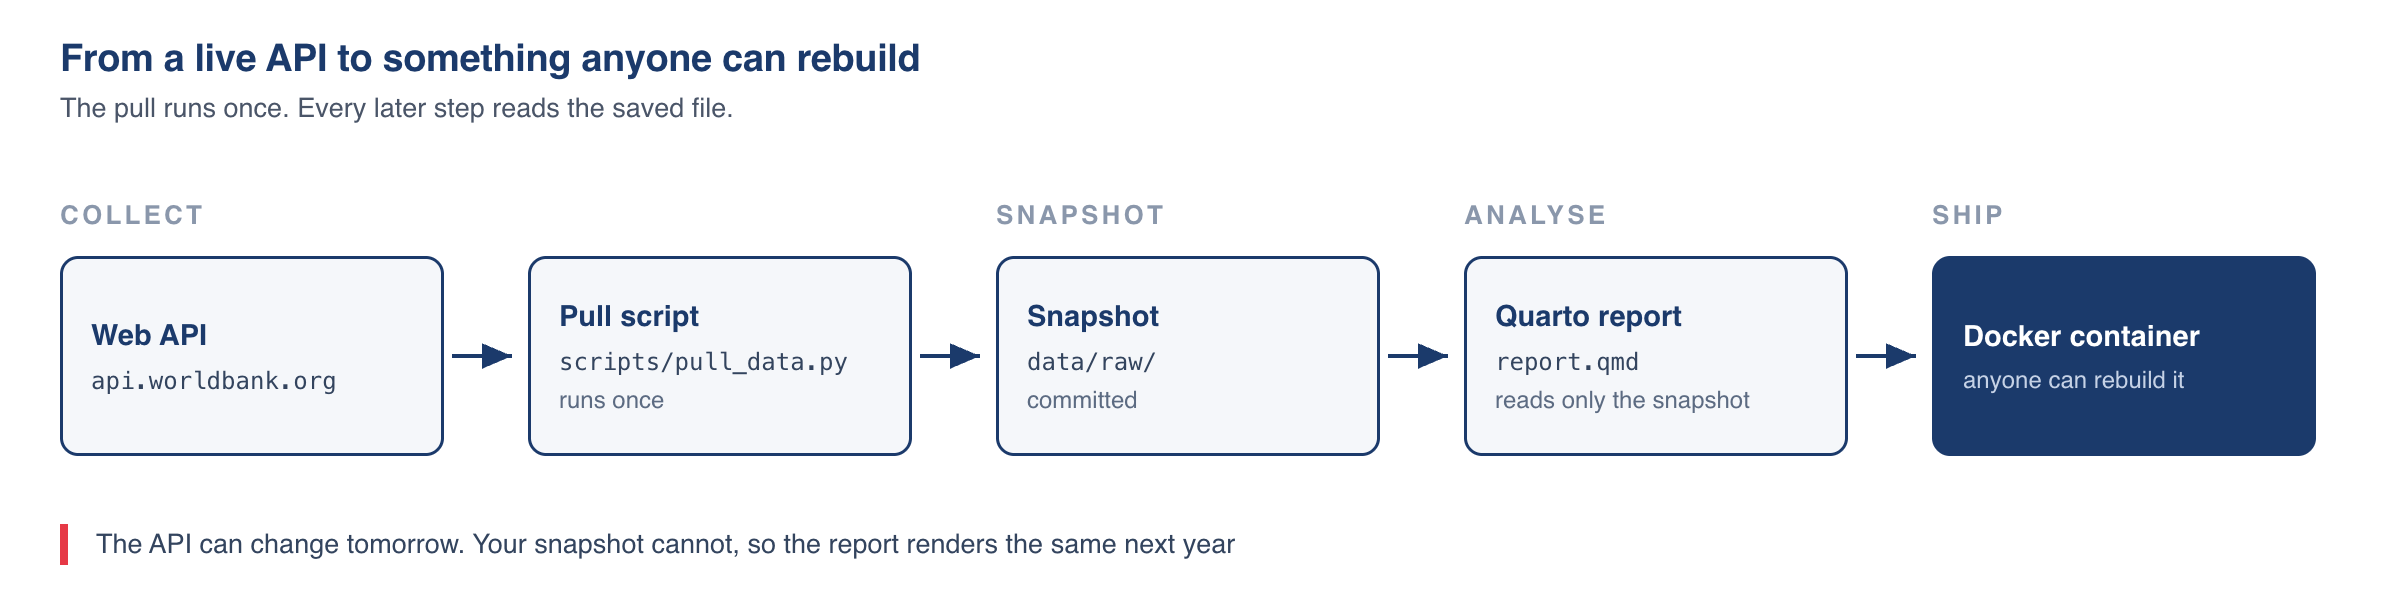
- Collect:
requestspulls data from a web API, as we did today - Snapshot: the script saves the raw reply and a tidy CSV in
data/raw/ - Analyse: pandas or DuckDB do the work, and Quarto writes the report
- Ship: a Docker container renders the report on anyone’s machine, later in the course
pull_data.py, part 1: the settings
The only lines you have to change
# The World Bank indicator code. This one is
# life expectancy at birth.
INDICATOR = "SP.DYN.LE00.IN"

# The countries you want, as ISO three-letter
# codes, joined by ";".
COUNTRIES = "BRA;IND;NGA;USA"

# The years to cover, written as "first:last".
YEARS = "2000:2023"

# A short, readable name for the output files.
OUTPUT_NAME = "life_expectancy"- The script is in the starter repository, under
scripts/ - These four settings sit at the top of the file
- Names in capital letters are constants: values that stay the same while the script runs
COUNTRIESuses the;you saw today- Pick your indicators at data.worldbank.org/indicator
- Everything below the settings rarely needs changing
pull_data.py, part 2: the request
Everything from the requests section, in one function
def fetch_indicator(indicator, countries, years):
    url = f"{BASE_URL}/country/{countries}/indicator/{indicator}"
    params = {
        "format": "json",
        "date": years,
        "per_page": 20000,
    }
    response = requests.get(url, params=params, timeout=60)
    response.raise_for_status()

    payload = response.json()
    if not isinstance(payload, list) or len(payload) < 2:
        raise RuntimeError(f"Unexpected response from the API: {payload}")

    return payload
Comments and type hints removed to fit the slide. The file itself explains every line
defcreates a function: a named block of code you can run laterreturn payloadhands the reply back to whoever called the function- The
f"..."string fills in the values inside{ }.BASE_URLis set near the top of the file:https://api.worldbank.org/v2 per_page=20000fits everything on one pageraise RuntimeError(...)stops the script with a message, likeraise_for_status()- The length check is the one we wrote today
pull_data.py, part 3: the table
Today’s loop, written in a shorter form
The starter’s version
Today’s version, which does the same
- The starter uses a list comprehension: the
forgoes inside the brackets - Both build the same list. Use whichever you find easier to read
dropna(subset=["value"])removes rows with no value
pull_data.py, part 4: running it
Save the raw reply, then the tidy table
Run it once, from the top folder of your repository:
The output, with the long folder paths shortened:
Requesting https://api.worldbank.org/v2/country/BRA;IND;NGA;USA/indicator/SP.DYN.LE00.IN
Saved the raw response to data/raw/life_expectancy_raw.json
Saved 96 tidy rows to data/raw/life_expectancy.csv

First few rows:
  country_code country       indicator  year   value
0          BRA  Brazil  SP.DYN.LE00.IN  2000  69.584
1          BRA  Brazil  SP.DYN.LE00.IN  2001  69.980
2          BRA  Brazil  SP.DYN.LE00.IN  2002  70.396

Now commit both files in data/raw/ to your repository.- The script saves two files:
- The untouched reply, as JSON
- The tidy table, as CSV
- The raw file lets you fix the tidying later without calling the API again
- 96 rows: 4 countries × 24 years
- Commit both files. Your report reads the saved CSV, never the live API
- That is why the report gives the same numbers in December
- The last line of the file,
if __name__ == "__main__":, runs the script only when you call it directly
If your API needs a key or sends pages
Only for Track B. The World Bank needs neither
API keys
- Some APIs need a key, a password for programs
- You used one in Lecture 14
- Keep it in a
.envfile, and put.envin.gitignore - Never commit a key. Bots find them in public repositories within minutes
- Details and code: Appendix 04
Pages
- Some APIs send long results in pages
- The reply says how many pages there are
- You ask for page 1, then page 2, and so on, until the last one
- First try a bigger page, like
per_page=20000. One request is simpler than a loop - Details and code: Appendix 05
What the project asks of you
Clone the starter, change four lines, run it once
| File | What it does |
|---|---|
scripts/pull_data.py |
Runs once: python scripts/pull_data.py |
data/raw/<name>_raw.json |
The untouched API reply |
data/raw/<name>.csv |
The tidy table your report reads |
report.qmd |
Reads only the saved copy, 1,500 to 2,500 words |
Dockerfile |
Builds the image your report renders in |
requirements.txt |
Pinned versions, so the build is the same next month |
- Commit
data/raw/. Do not put it in.gitignore - The report never calls the API while it renders
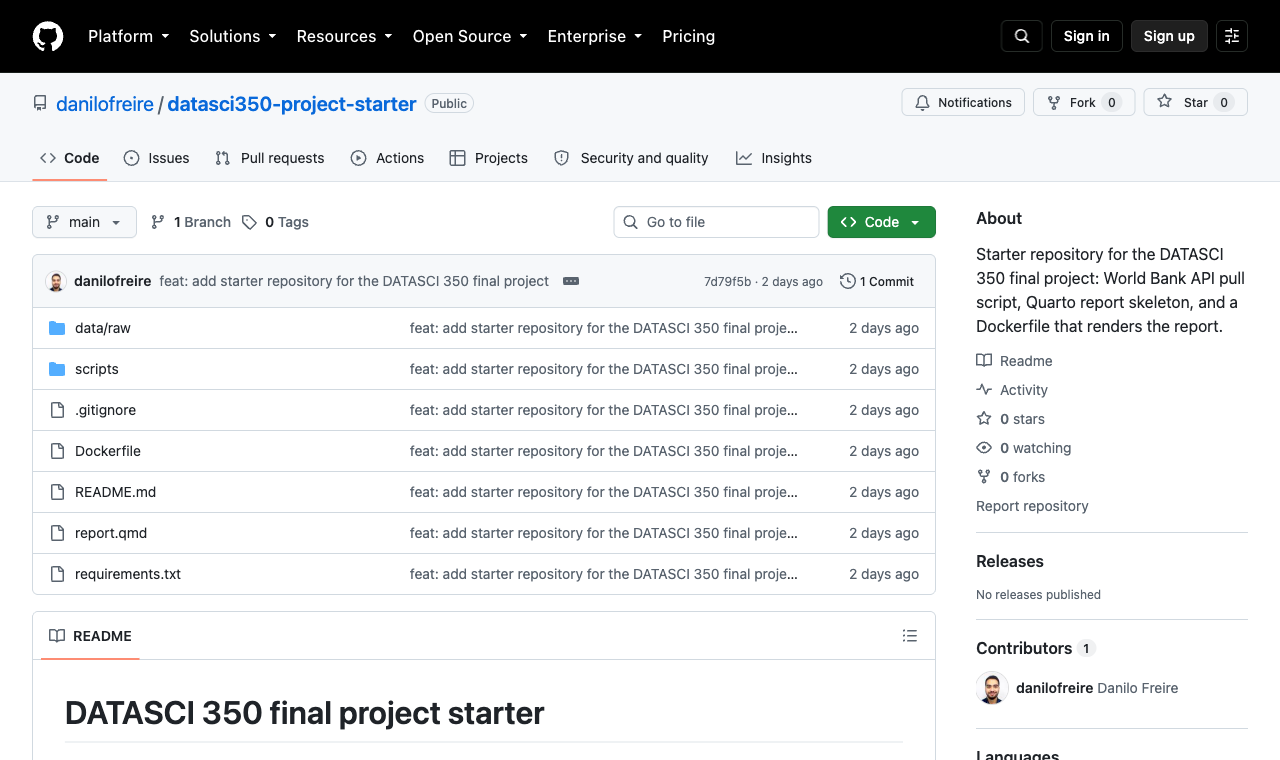
The starter repository: github.com/danilofreire/datasci350-project-starter
A file we will use again
The course panel, for Lectures 21 and 22
- I used the same steps to build a bigger file:
wdi_panel.parquet - Eight World Bank indicators, 217 countries, 1990 to 2023
- 59,024 rows, one per country, indicator, and year
- It is saved as parquet, a compact file format. Lecture 21 explains it
- In Lecture 21 we ask why one CPU core is not enough
- In Lecture 22 we query this file with SQL
The eight indicators include GDP per capita, population, life expectancy, and CO2 emissions per person
The script that built it, and the full list, are in the appendix
Conclusion 📚
What we learned today
From an API reply to a saved table, in Python
- JSON objects become dictionaries, and arrays become lists
with open(...) as f:opens a file and closes it for youjson.loadreads JSON, andjson.dumpwrites it- A path becomes square brackets:
wb[1][0]["value"] requests.get(url, params=..., timeout=30)sends the requestraise_for_status()and a length check catch the errors
- A
forloop picks the fields you want from each record pd.DataFrame(rows)turns the list into a table;asks for many countries, andper_pagegets them in one replynullbecomesNaN, anddropna()removes itto_csv(..., index=False)saves the table for your report- Your project’s
pull_data.pydoes all of this, and you can now read every line
Next class
- Quiz 03 is next class, covering Lectures 12, 14, 15, 16 and 17
- Revise the exercises from those lectures and you will be well prepared
- Lecture 21 starts parallel computing
- One question left from this module: what if the data is on a web page, with no API?
- The optional web-scraping tutorial (link) covers that, from HTML tables in pandas to BeautifulSoup
Before then
- Email me your group’s names, or I assign you a group at random
- Clone the starter repository and run
python scripts/pull_data.pyonce - Finish Exercise 03 if you did not have time in class
- Revise Lectures 12 to 17 for the quiz
And that’s all for today! 🤓
Appendix 01
Exercise 01 solution
wb[0]is the metadata, andtotalis one of its keys- Records run newest first, so 2020 is at position
5(2025 is at0) - Last class’s path
1→5→valuebecomeswb[1][5]["value"] - Every record holds the country, so
wb[1][0]works as well as any other
Appendix 02
Exercise 02 solution
import json
import requests

url = "https://api.worldbank.org/v2/country/URY/indicator/SP.POP.TOTL"
params = {"format": "json", "date": "2014:2025"}

r = requests.get(url, params=params, timeout=30)
r.raise_for_status()
payload = r.json()

if len(payload) < 2:
    print("No data:", payload)
else:
    with open("data/wb_pop_ury.json", "w") as f:
        json.dump(payload, f, indent=2)
    print(r.url)
print("Saved", payload[0]["total"], "records")- Only
URYandSP.POP.TOTLchanged. Theparamsare the same for every indicator - With
XYZ, the length check prints the “No data” message, and no file is written - If the
data/folder does not exist,openfails. Create the folder first
Appendix 03
Exercise 03 solution
import requests
import pandas as pd

url = "https://api.worldbank.org/v2/country/ARG;BRA;URY/indicator/NY.GDP.PCAP.KD"
params = {"format": "json", "date": "2014:2025", "per_page": 1000}

r = requests.get(url, params=params, timeout=30)
r.raise_for_status()
payload = r.json()

rows = []
for record in payload[1]:
    rows.append({
        "country": record["country"]["value"],
        "year": int(record["date"]),
        "value": record["value"],
    })

df = pd.DataFrame(rows)
print(df.shape)
print(df["value"].isna().sum())

latest = df[df["year"] == 2025]
latest = latest.sort_values("value", ascending=False)
print(latest)

df.to_csv("data/gdp_south_america.csv", index=False)- 36 records fit in one reply, so there is one page
- The length check is left out here to fit the slide. Keep it in your own code
- Uruguay’s GDP per capita is about twice Brazil’s
Appendix 04: API keys
For Track B APIs that ask who you are
- Sign up on the API’s website. The key usually arrives by email in a minute
- Put it in a file called
.env, oneNAME=valueper line, with no quotes
NASA_API_KEY=abc123def456- Add
.envto your.gitignorebefore your first commit - Read it in Python with
python-dotenv, as in Lecture 14
- Send it the way the documentation says:
- Headers are safer because URLs get saved in logs and browser history
- GitHub found more than 39 million leaked secrets in 2024
- Committed a key by accident? Revoke it at once and get a new one. Deleting the file does not help, because Git keeps the history
Appendix 05: pages
A loop that asks for one page at a time
GDP per capita for every country in 2023, 100 records per page
import time
import requests

url = "https://api.worldbank.org/v2/country/all/indicator/NY.GDP.PCAP.KD"
records = []
page = 1

while True:
    params = {"format": "json", "date": 2023,
              "per_page": 100, "page": page}
    r = requests.get(url, params=params, timeout=30)
    r.raise_for_status()
    payload = r.json()

    records.extend(payload[1])
    print("page", page, "of", payload[0]["pages"])

    if page >= payload[0]["pages"]:
        break
    page = page + 1
    time.sleep(0.5)

print(len(records), "records")while True:repeats until abreak- The metadata says how many
pagesthere are, so the loop knows when to stop records.extend(...)adds a whole page of records to the listtime.sleep(0.5)waits half a second between requests, to be polite to the server- A
429status means you are asking too fast. Wait and try again - The saved pages are in
data/(wb_gdppc_2023_page1.jsontopage3)
Appendix 06: how the course panel was built
The script, the columns, and the eight indicator codes
data/wdi_panel.parquet holds eight indicators for every country (regional and income groups such as “World” are dropped) from 1990 to 2023, in long format
| Column | Type | Meaning |
|---|---|---|
country |
category | Country name |
iso3 |
category | Three-letter country code |
indicator |
category | Short name, one of the eight |
year |
int16 | 1990 to 2023 |
value |
float64 | The observation, NaN where missing |
| Short name | WDI code |
|---|---|
gdp_per_capita |
NY.GDP.PCAP.KD |
population |
SP.POP.TOTL |
life_expectancy |
SP.DYN.LE00.IN |
co2_per_capita |
EN.GHG.CO2.PC.CE.AR5 |
internet_users_pct |
IT.NET.USER.ZS |
urban_pop_pct |
SP.URB.TOTL.IN.ZS |
fertility_rate |
SP.DYN.TFRT.IN |
primary_enrolment_net |
SE.PRM.NENR |
The script is data/build_wdi_panel.py. It saves the raw replies in data/raw/, so a second run makes no network requests