DATASCI 350 - Data Science Computing

Lecture 11 - Quarto in Practice

Danilo Freire

Department of Data and Decision Sciences
Emory University

Hello, everyone! 😊

Recap of our last lecture

In our last class, we covered

  • The reproducibility crisis, and the mundane reason most results fail: the code does not run
  • The habits that fix it: project structure, raw data left alone, relative paths, seeds, recorded versions
  • Quarto and its three parts: YAML header, Markdown, and code chunks
  • quarto render builds a document; quarto preview keeps a live one open
  • Every render is a restart-and-run-all test of your analysis
  • You wrote and rendered your first document. Today we put Quarto to work
---
title: My Quarto Document
subtitle: A simple example
author: Danilo Freire
date: 2026-09-18
format:
  html:
    theme: cosmo
    embed-resources: true
---

# Introduction

This is a simple Quarto document.

```{python}
print("Hello, world!")
```

## Subsection

[Link](https://www.emory.edu).

Today’s lecture

Last class you rendered one HTML page. Today that same skill fans out:

  • Markdown beyond the basics: tables, footnotes, maths
  • PDFs and citations that format themselves from a .bib file
  • freeze: rendering documents without re-running the world
  • Slides (like these) and websites, published free from GitHub
  • Parameterised reports: one file that writes a report for every country in your dataset
  • Two exercises along the way, so bring your laptop battery

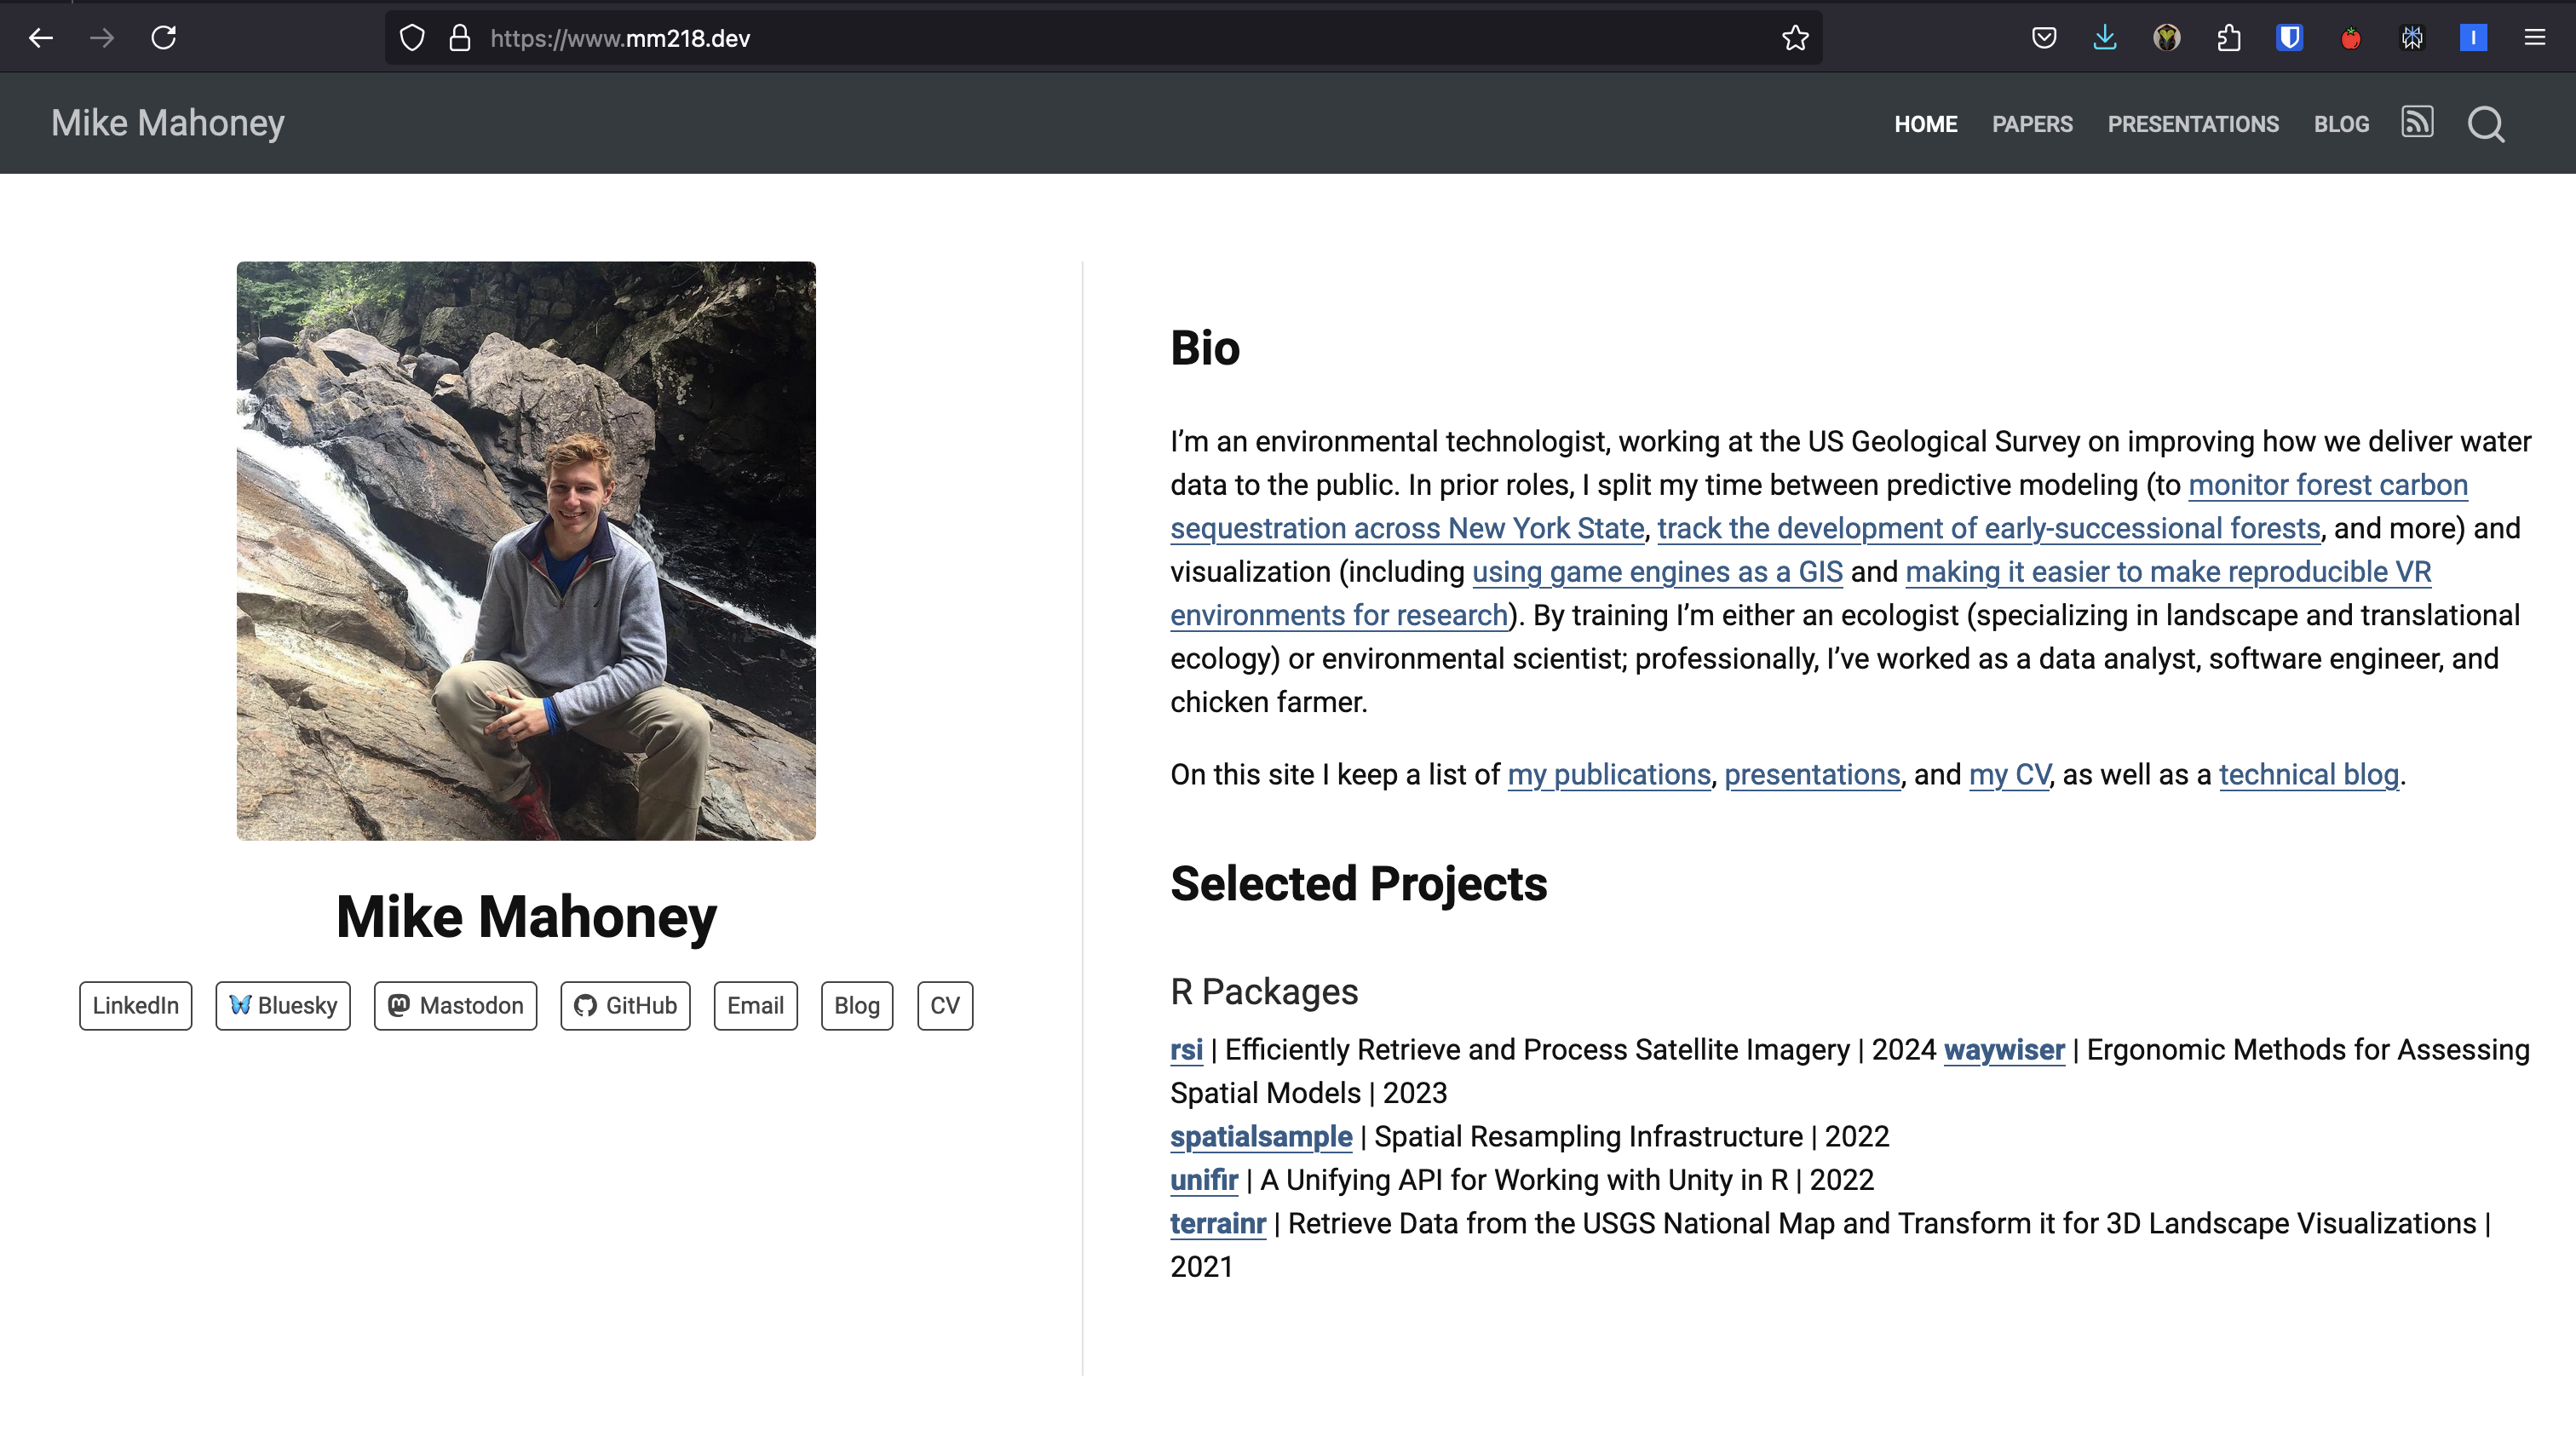
A Quarto website, minutes after quarto publish. You build one today

Markdown, PDFs, and citations 🛠️

Markdown you will use every week

You type You get
**bold**, *italic* bold, italic
~~scratch that~~ scratch that
[text](url) a link
![caption](img.png) an image
`code` code
> quote a blockquote
2^10^, H~2~O 210, H2O
footnote[^1] a numbered footnote
  • Tables: pipes and dashes, with colons setting the alignment
| Left | Centre | Right |
|:-----|:------:|------:|
| a    | b      | c     |
  • Maths is LaTeX between dollar signs: $\mu = \frac{1}{n}\sum x_i$ inline, $$ ... $$ for display equations
  • The LaTeX Wiki lists the symbols; the Markdown Guide covers the rest
  • That is most of the language. Markdown is small on purpose

Markdown, raw and rendered

# Heading 1

This is a paragraph[^1].

## Heading 2

This is *italic*, this is `code`,
this is ~~strikethrough~~.

This is a [link](https://www.emory.edu).
Equation: $\mu = \frac{1}{n} \sum_{i=1}^{n} x_i$

List:

- Item 1
- Item 2
  - Subitem 1

[^1]: This is a footnote.

| Header 1 | Header 2 | Header 3 |
|:---------|:--------:|---------:|
| Cell 1   | Cell 2   | Cell 3   |

Heading 1

This is a paragraph1.

Heading 2

This is italic, this is code, this is strikethrough.

This is a link. Equation: \(\mu = \frac{1}{n} \sum_{i=1}^{n} x_i\)

List:

  • Item 1
  • Item 2
    • Subitem 1
Header 1 Header 2 Header 3
Cell 1 Cell 2 Cell 3

Rendering Jupyter notebooks

  • Quarto renders existing .ipynb notebooks directly. No rewriting needed
  • Add a YAML header in the first cell (as raw text) and run:
Terminal
quarto render notebook.ipynb --to html
  • By default Quarto uses the outputs already stored in the notebook. Add --execute to re-run the code first
  • If Quarto cannot find your Python, quarto check jupyter diagnoses it, and the QUARTO_PYTHON variable fixes it
  • Writing .qmd from the start is still nicer for long documents, but old notebooks convert as they are

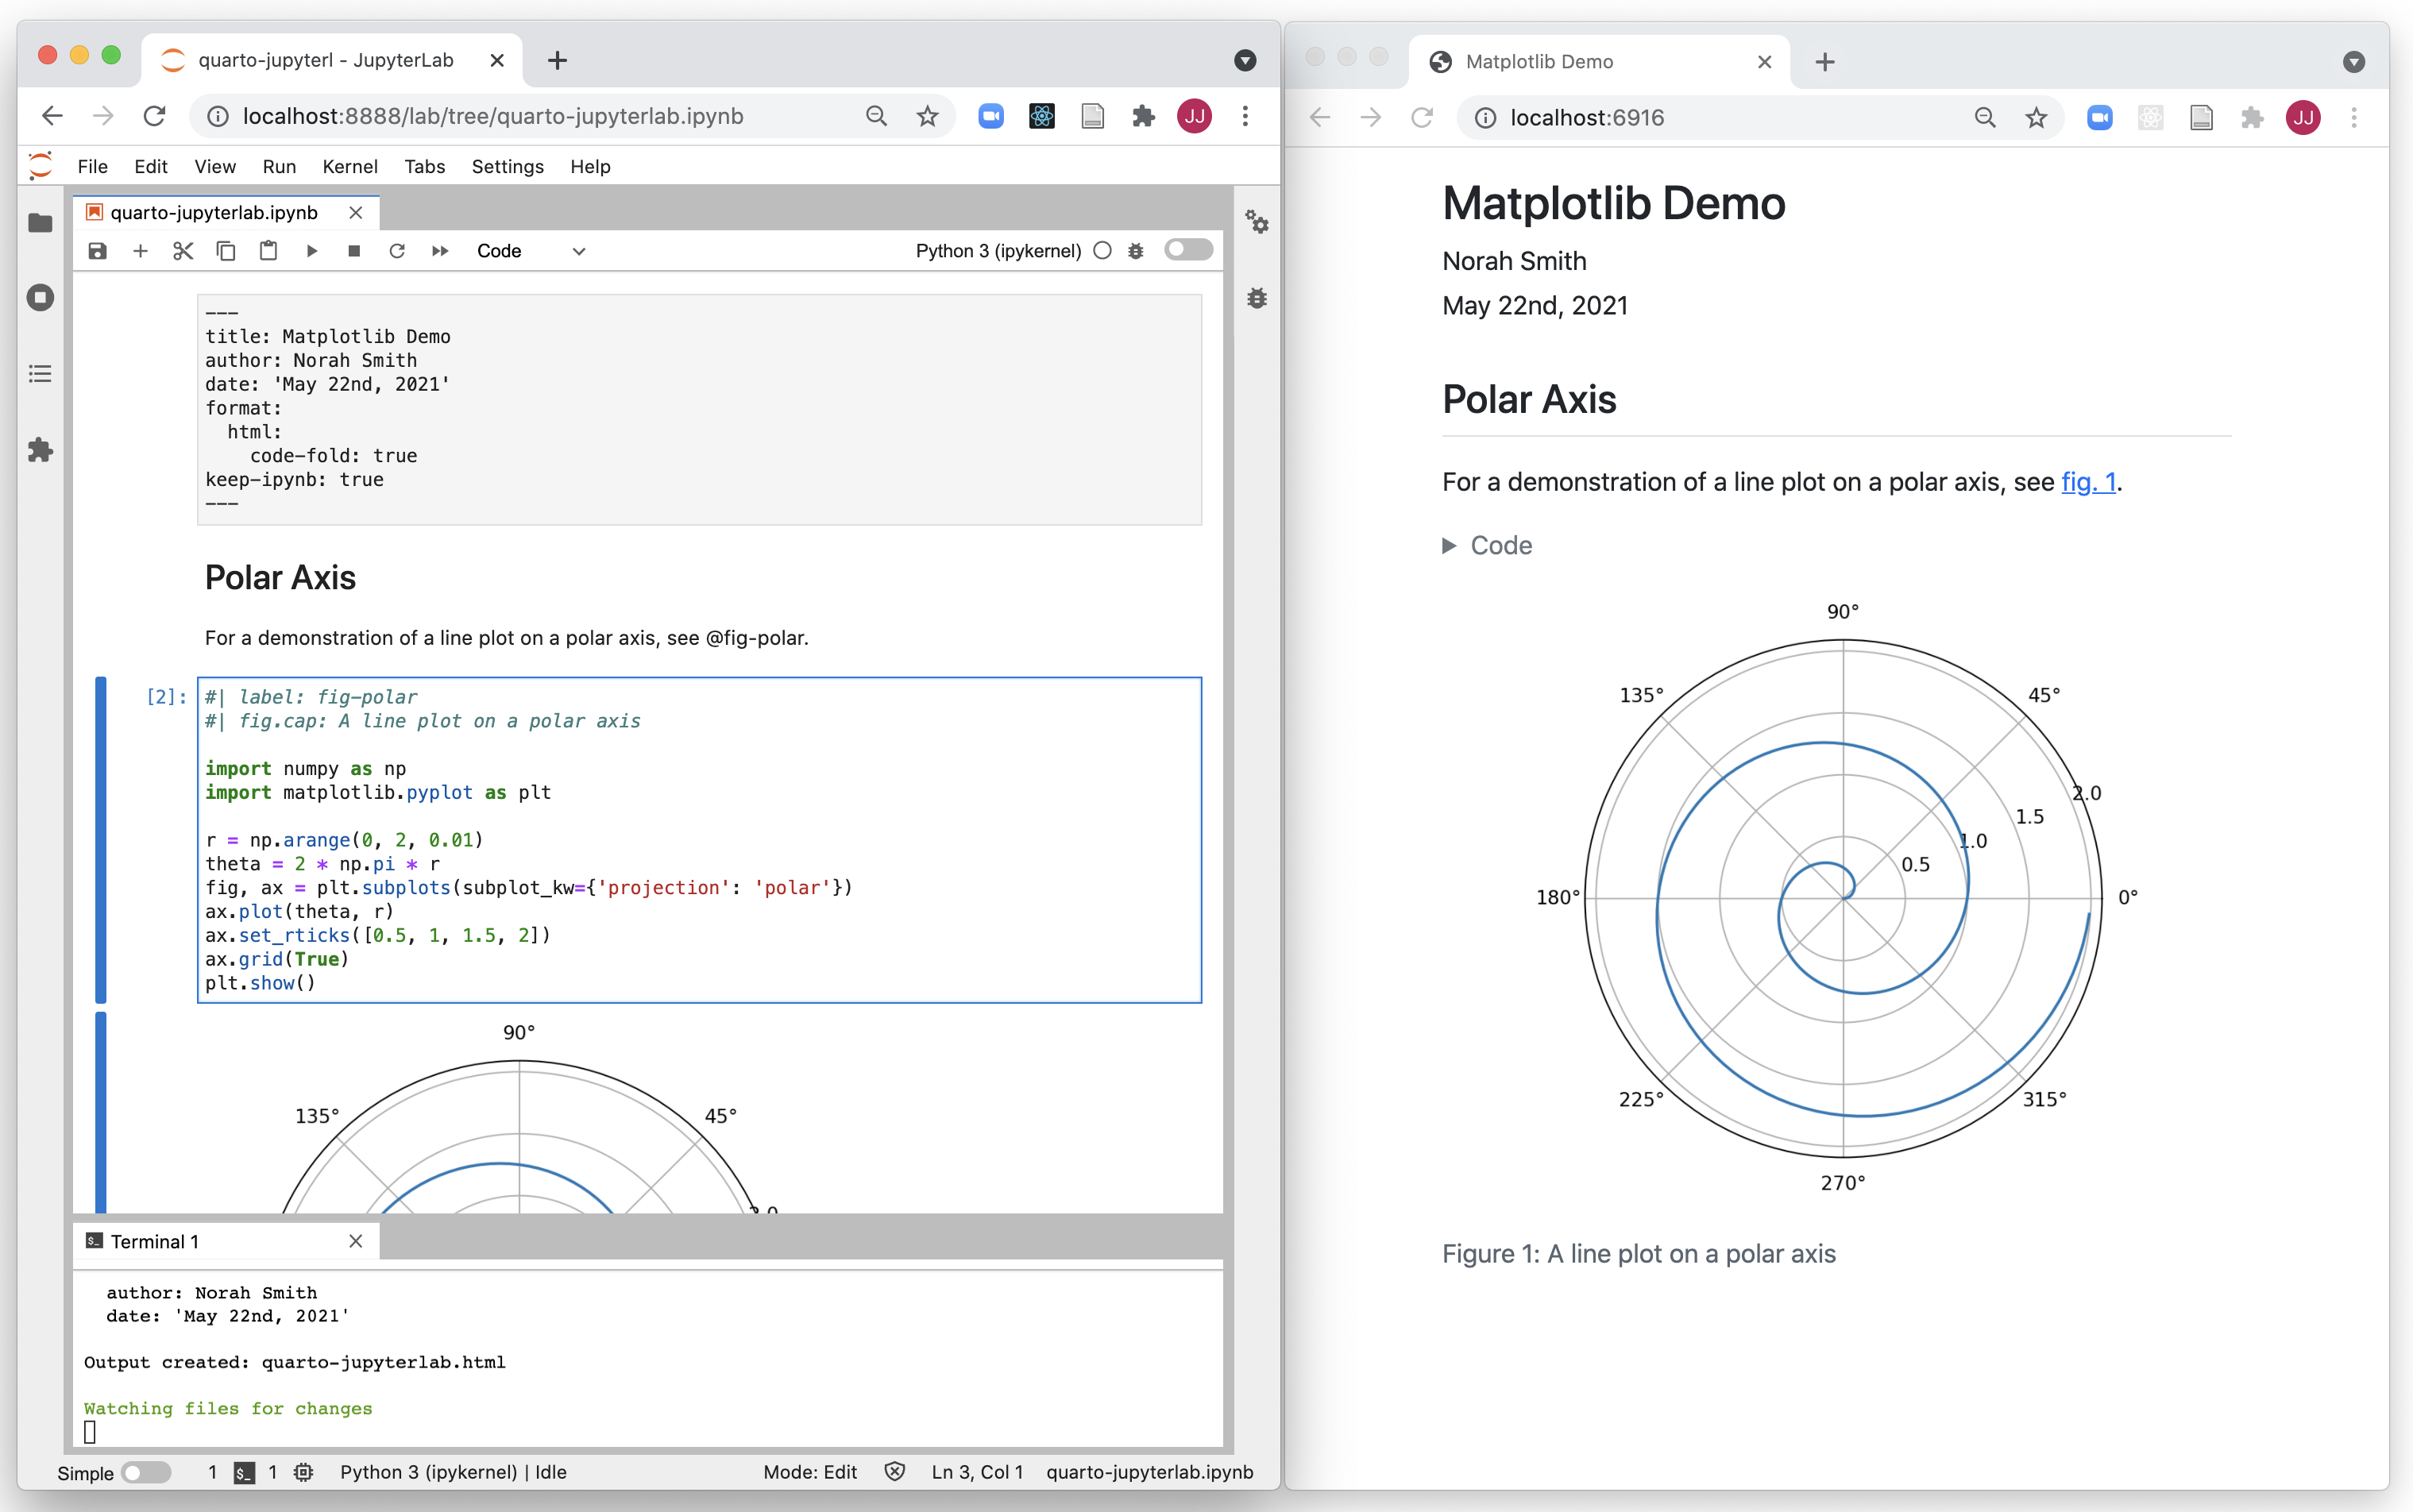
The same notebook, rendered. More details here

PDFs

  • Most journals, agencies, and employers still want PDF
  • PDF rendering goes through LaTeX, and you installed TinyTeX last class (quarto install tinytex)
  • After that, PDF is one flag:
Terminal
quarto render report.qmd --to pdf
  • The same works on a notebook, and --execute re-runs it first:
Terminal
quarto render notebook.ipynb --to pdf --execute
  • Fonts, margins, and page geometry are all YAML options: see the PDF basics guide

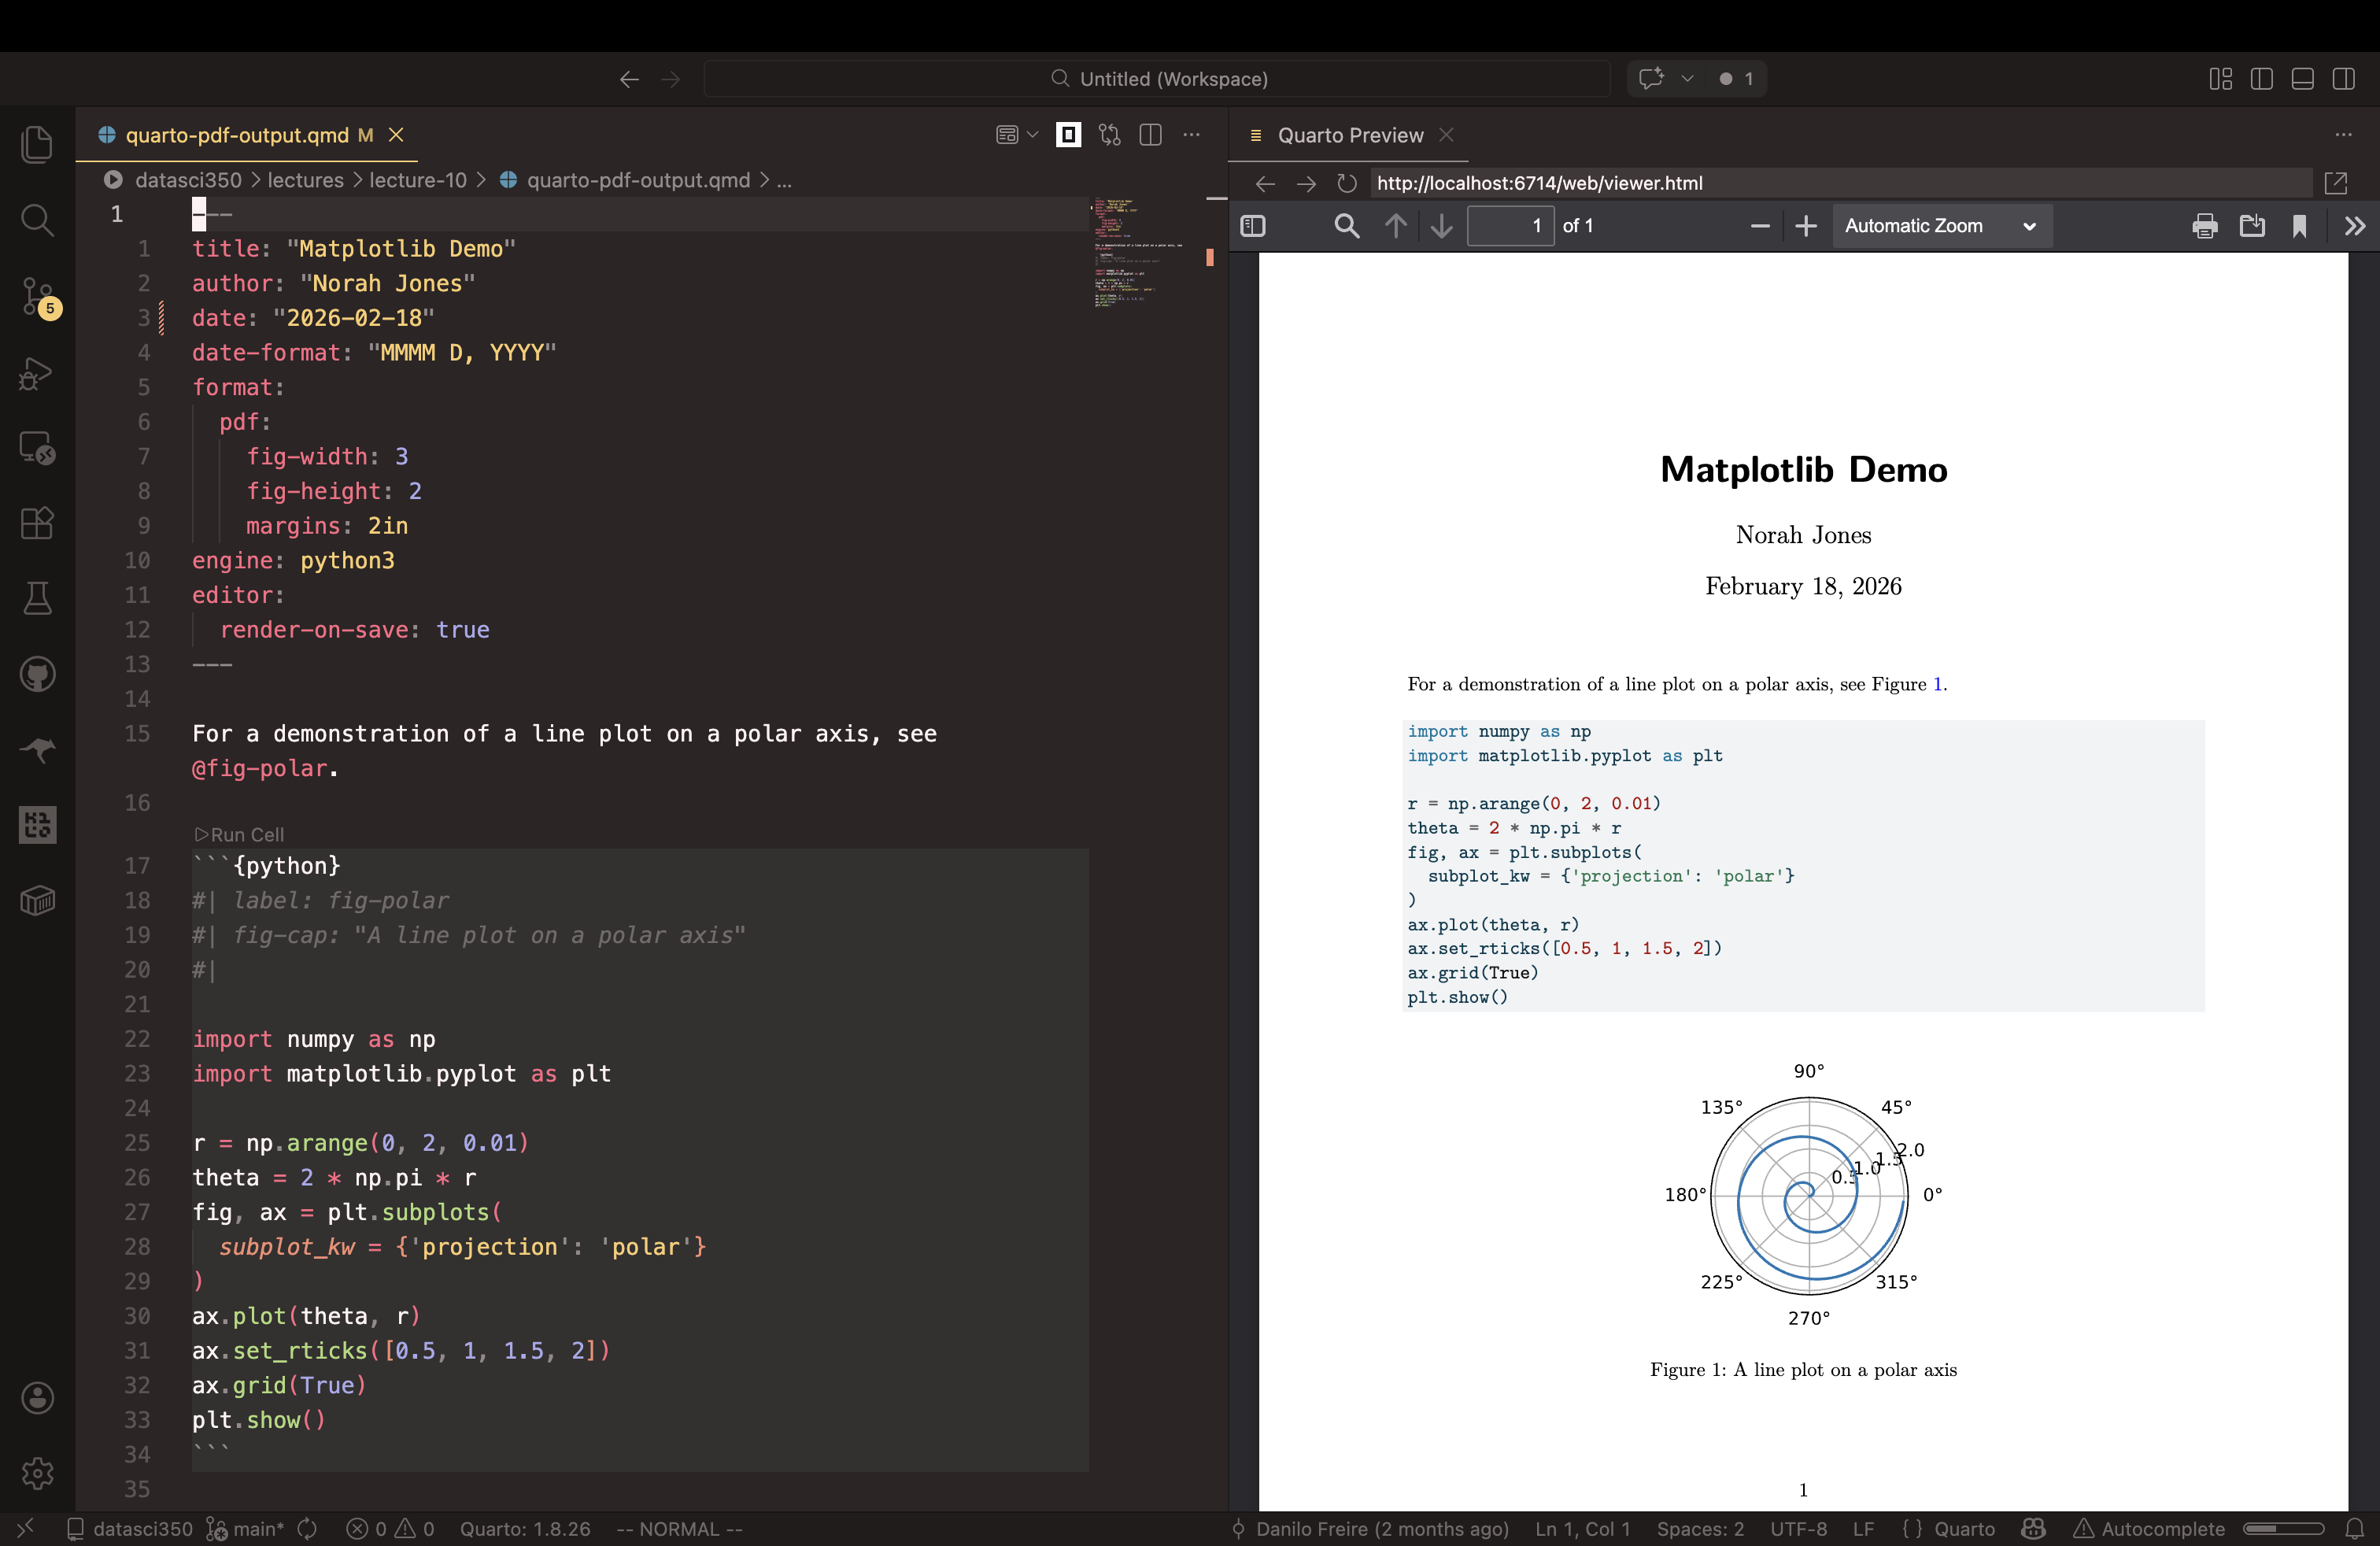
Rendering a PDF

Citations with BibTeX

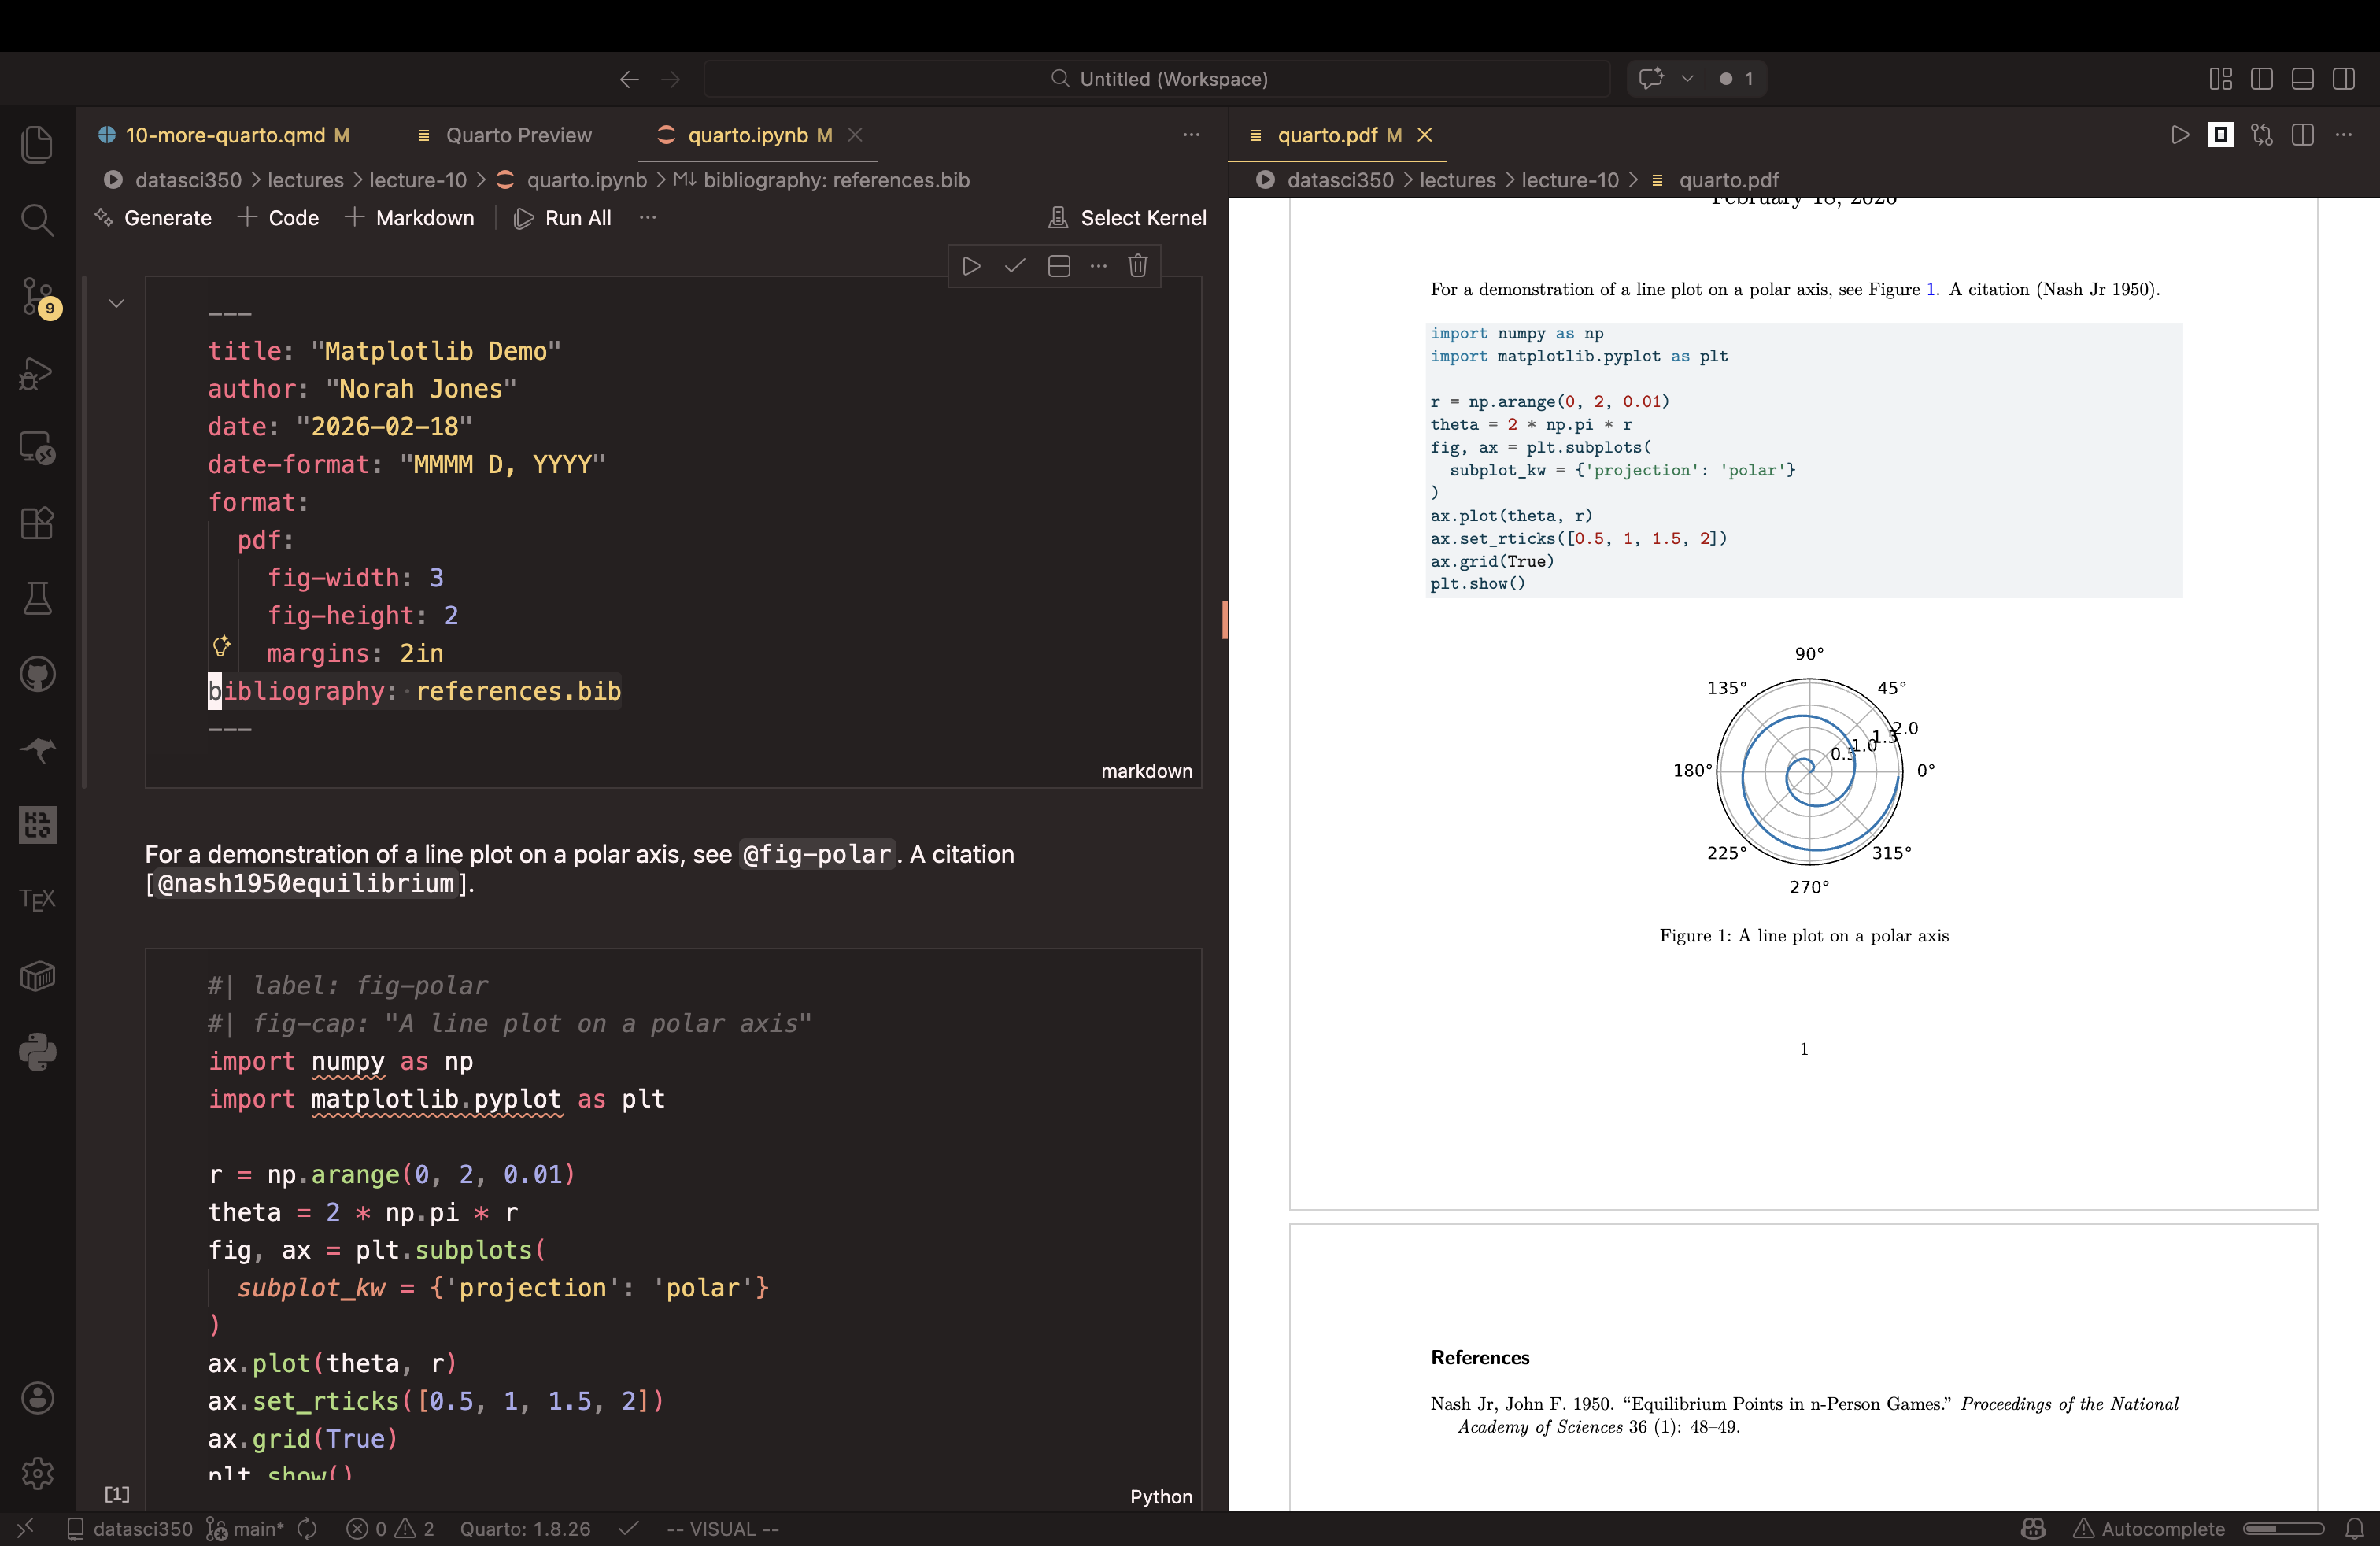
  • Formatting references by hand is slow, and updating them by hand is how errors creep in. BibTeX automates both
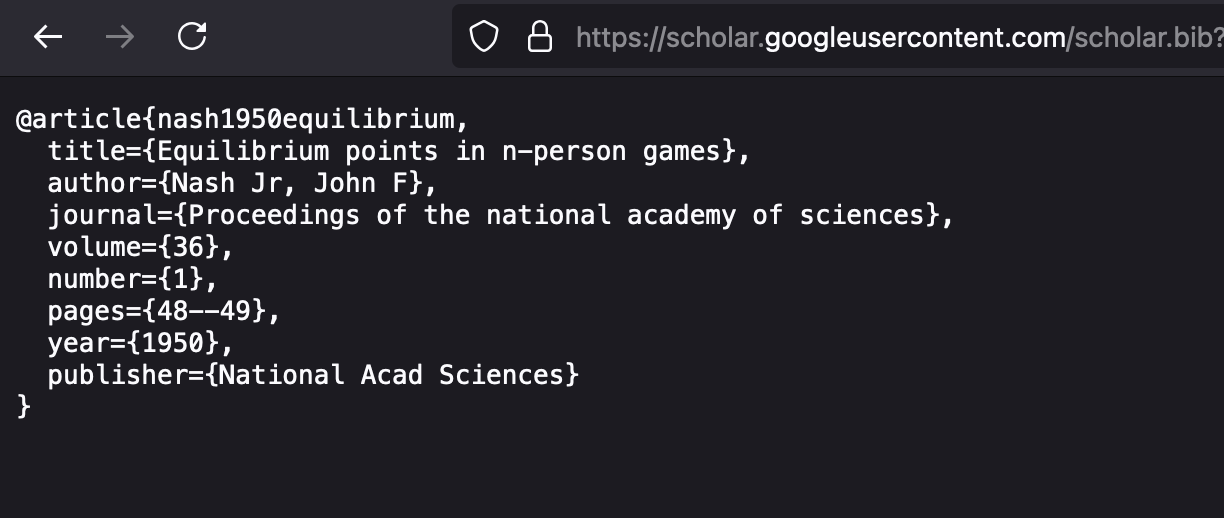
  • A .bib file is plain text: one entry per source, each with a citation key (here, nash1950equilibrium)
  • Point your YAML at the file:
bibliography: references.bib
  • Then cite by key in your prose:
    • @nash1950equilibrium → Nash (1950)
    • [@nash1950equilibrium] → (Nash 1950)
    • [@nash1950equilibrium, p. 48] → (Nash 1950, p. 48)
  • Quarto formats the citations and appends the reference list. Change the style with one line: csl: apa.csl (thousands of styles here)
@article{nash1950equilibrium,
  title={Equilibrium points in n-person games},
  author={Nash Jr, John F},
  journal={Proceedings of the national
           academy of sciences},
  volume={36},
  number={1},
  pages={48--49},
  year={1950},
  publisher={National Acad Sciences}
}
  • Cite it once or fifty times: the entry lives in one place
  • Delete the citation and the reference list updates itself on the next render
  • More at the Quarto citations guide

Where BibTeX entries come from

  • You almost never type an entry by hand
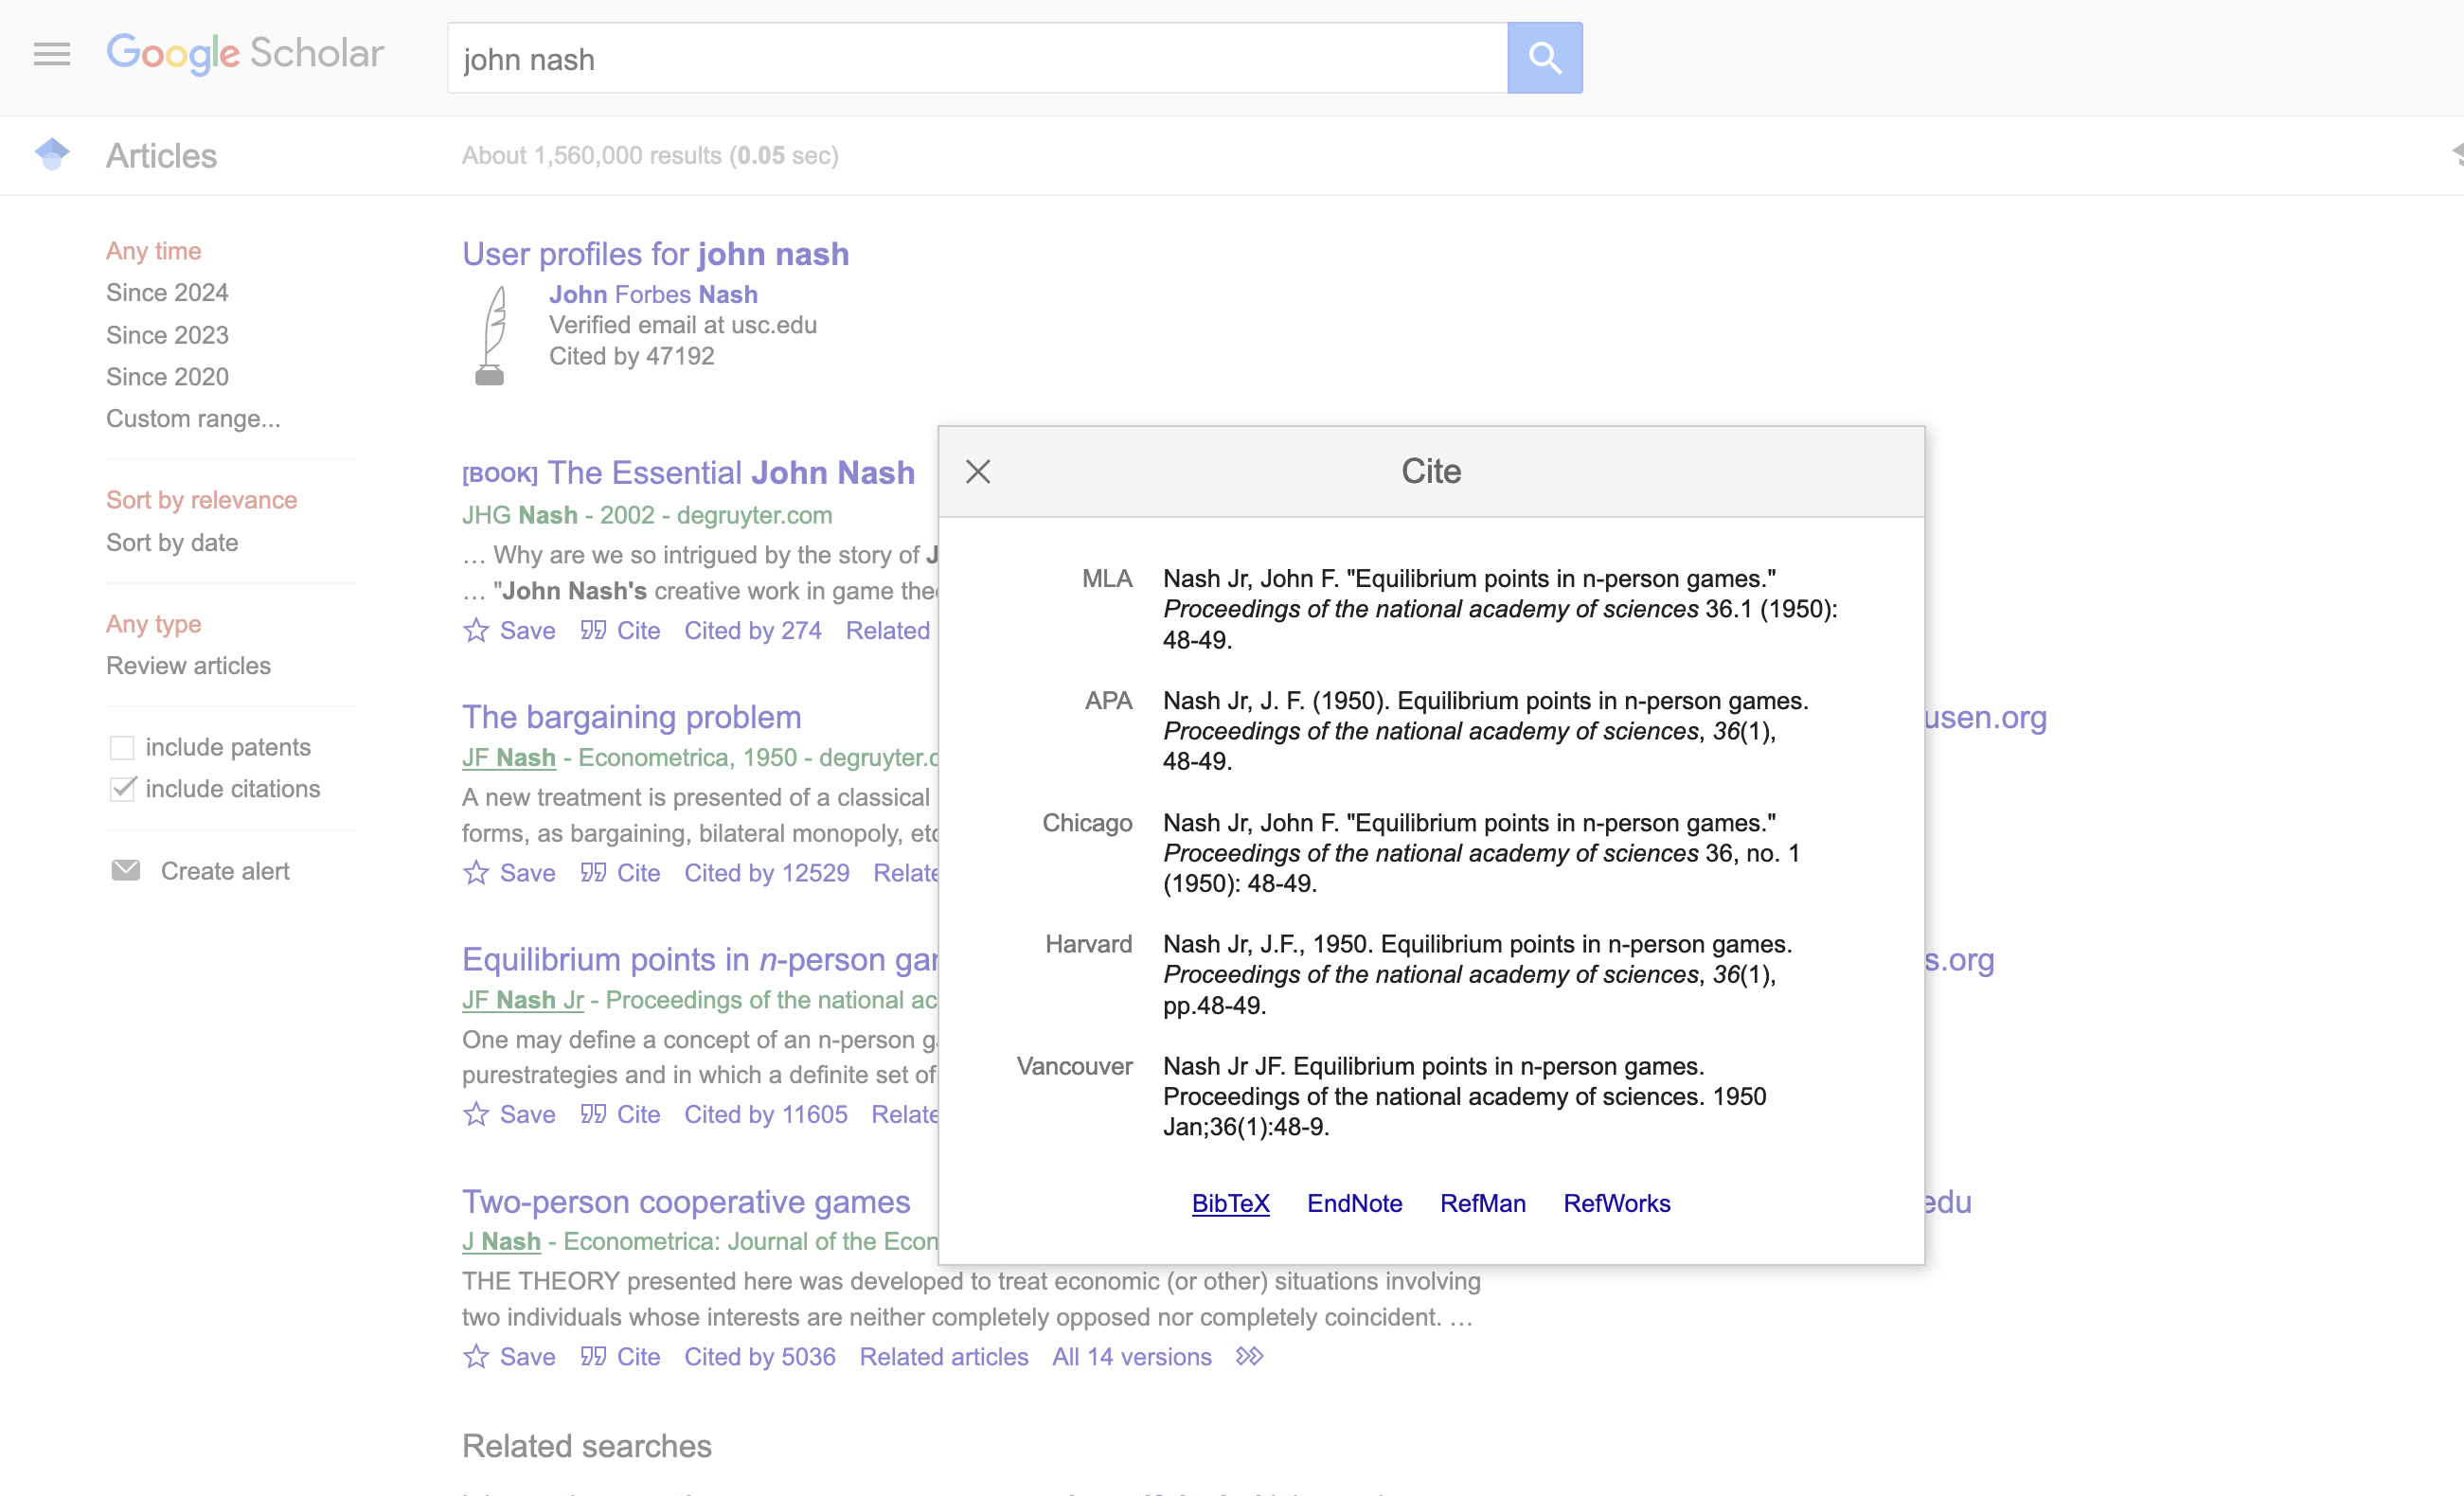
  • On Google Scholar, click Cite, then BibTeX, and copy the result into your .bib file
  • For anything bigger than a homework, use a reference manager: Zotero is free, open source, and exports .bib files that stay in sync with your library
  • Check the entries you import: Scholar sometimes gets capitalisation and journal names wrong, and the error lands in your reference list

Cross-references: the other @

A citation points outside your document. A cross-reference points inside it. Label the chunk, then use the label:

```{python}
#| label: fig-rain
#| fig-cap: "Monthly rainfall in Atlanta"
plt.plot(month, rain)
```

Rainfall peaks in March (@fig-rain).

That last line renders as Rainfall peaks in March (Figure 1)

Markdown tables take the label underneath, after a colon:

| City     | Population |
|:---------|-----------:|
| Atlanta  |    498,715 |
| Savannah |    147,780 |

: Two cities {#tbl-cities}
  • The prefix tells Quarto what it is numbering: fig-, tbl-, eq-, sec-, lst-
  • Write label: rainfall with no prefix and the caption still appears, with no number, while @rainfall sits in your text as raw text
  • @sec- also needs number-sections: true in the YAML
  • [-@fig-rain] prints the bare number, for when you are already inside brackets
  • Add a figure halfway through the document and every number renumbers itself, in the captions and in your prose
  • The same labels work in HTML and PDF, so you write the sentence once

This is why we number nothing by hand. Hand-typed “Figure 3” is wrong the moment you add Figure 2

Formatting LaTeX documents

  • Quarto’s default PDF looks fine. Journals, universities, and employers often want a specific look
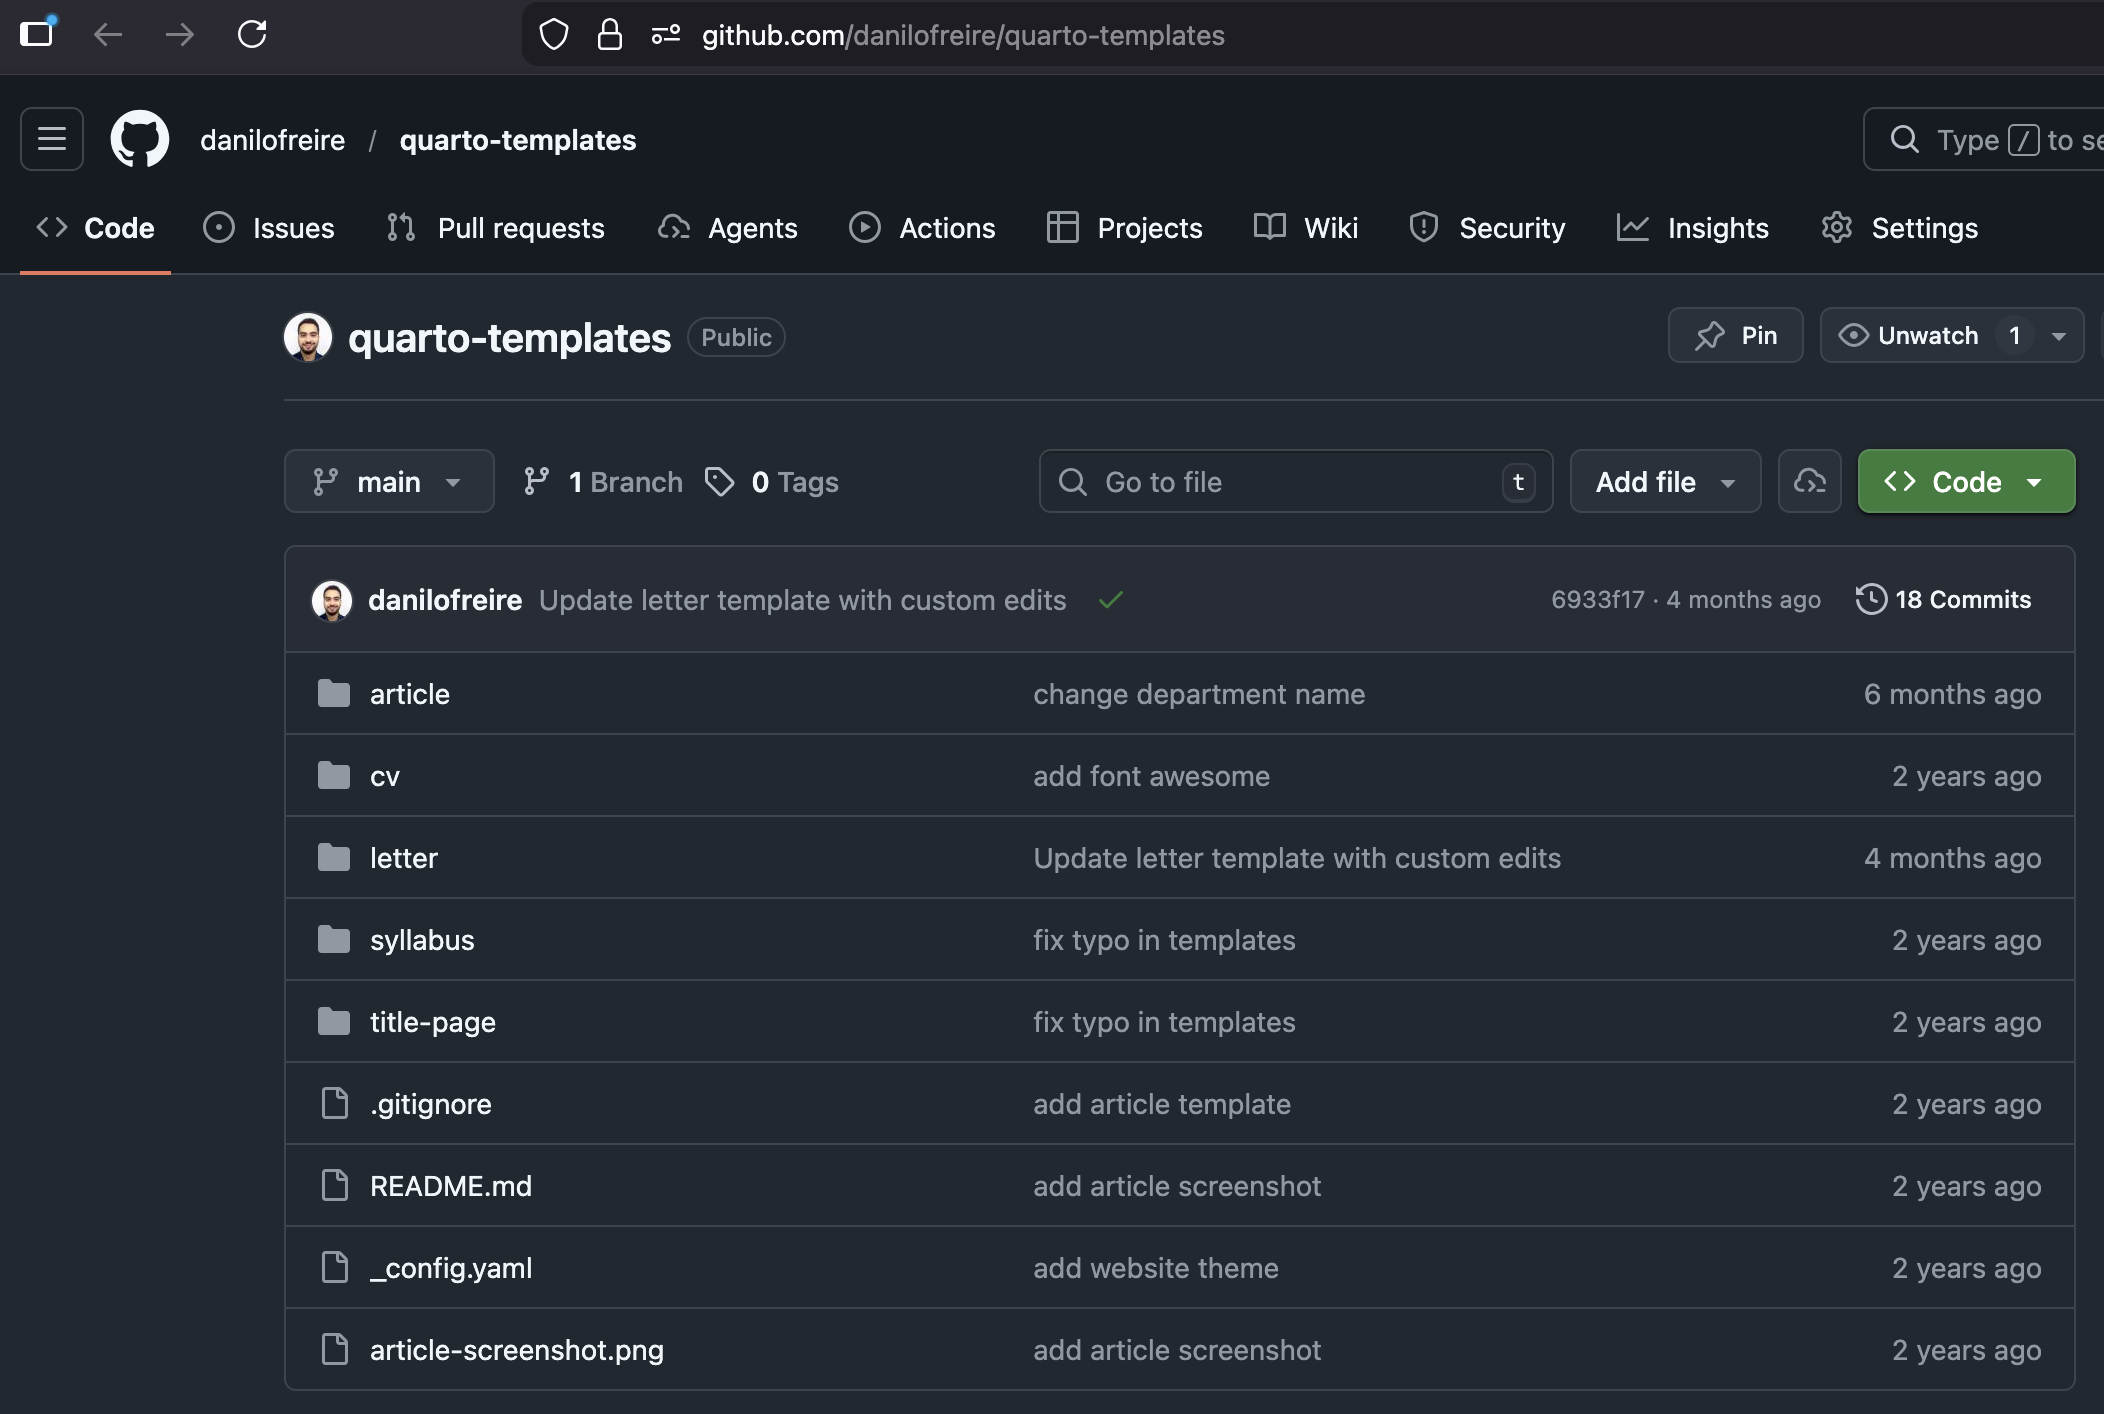
  • That is what LaTeX templates are for, and you do not have to write one: you point your YAML at one
format:
  pdf:
    template: your-template.latex

The template behind the course syllabus

Try it yourself!

  1. Create a file called practice.qmd in VS Code
  2. Write a YAML header with title, author, format: html, and bibliography: references.bib
  3. Add a ## heading, a paragraph, a bulleted list, and a small Markdown table
  4. Add a Python chunk that plots something (e.g., plt.plot) with these chunk options:
    • #| echo: true and #| eval: true
    • #| fig-cap: "Your caption here"
    • #| label: fig-myplot
  5. Reference the figure in your text with @fig-myplot
  1. Create a references.bib file with one BibTeX entry (grab one from Google Scholar)
  2. Cite it in your text with @key
  3. Render to HTML and to PDF:
Terminal
quarto render practice.qmd
quarto render practice.qmd --to pdf

The chunk options are on last week’s table: fig- labels are what @fig- references point at

Renders you can trust

The problem with re-rendering

  • You finish a report in October. In November you fix a typo and render it again
  • Between the two dates, pandas shipped a new version and one default changed
  • Your edit was one character. Three numbers in the results table are now different
  • You find out when a colleague asks why their printed copy disagrees with the website

Rendering and re-computing are the same action. Every render re-runs every chunk, whether the analysis changed or not

  • Nothing in your document changed! The ground under it did:

  • A package upgrade changes a default

  • An API hands you today’s data, not October’s

  • A random draw with no seed

  • Anything that reads the clock or today’s date

  • A different machine with different versions

What we want is controlled re-execution: code runs again when the source changes, and stays put otherwise

freeze: re-run only when the source changes

Put this in _quarto.yml for a project:

project:
  type: website

execute:
  freeze: auto

Or in the YAML header of a single document:

---
title: "Rainfall report"
format: html
execute:
  freeze: auto
---
  • Quarto runs the code once and stores the results in a folder called _freeze/
  • After that, a document re-runs only when its own source changes
  • freeze: auto: change the code, get new results. Change nothing, get the same results
  • freeze: true: never re-run. For archival work, a submitted paper or a signed-off report
  • freeze: false: the default, always re-run
  • Commit _freeze/. It travels with the project, so whoever clones your repository gets your numbers
  • Your site also rebuilds in seconds, because only the pages you edited run again

What freeze does and does not do

What it does

  • Controls when your code runs again
  • Keeps October’s results until you touch the source
  • Stops accidental re-computation
  • Makes a render fast and predictable

What it does not do

  • Control what your code runs with
  • Survive deleting _freeze/
  • Protect a machine with other package versions
  • Pin pandas to the version you tested

So freeze postpones the problem. The rest of the answer is to pin the environment, which is module 08: uv and containers. Until then, use freeze: auto, commit _freeze/, and write your versions in the README

Presentations and websites

Slides with reveal.js

  • Quarto renders slides with reveal.js, an HTML presentation framework
  • These very slides are Quarto + reveal.js!
  • Why bother, when PowerPoint exists?
    • Plain text: diffs, version control, merge conflicts that make sense
    • Code runs inside the slides: charts update when the data changes
    • One source, many formats: the same .qmd can also become a PDF handout
    • Free hosting: push to GitHub, share a link
  • Fair warning: the first deck takes longer than dragging boxes. The payoff is that your 50th deck is no harder than your 2nd

The YAML picks the format, and the headings do the rest:

title: "My Presentation"
author: "Your Name"
format:
  revealjs:
    embed-resources: true
  • # starts a section, ## starts a new slide
  • embed-resources: true bakes images and fonts into one self-contained file
  • ::: fenced divs handle layout: columns, centred text, font sizes
  • Chunks, images, tables, and citations work exactly as in a report
  • Full reference: Quarto reveal.js docs

Two decks to learn from

  1. A minimal deck with text and images: simple-slides.html, with its source in simple-slides.qmd, in this lecture’s folder (click on the links above)
  2. The template behind this course, with custom theme, columns, and modal images: quarto-presentation

Install the course template with:

Terminal
quarto install danilofreire/quarto-presentation

Things to try on your own:

  • Download the simple slides .qmd and render it locally
  • Change the theme (e.g., theme: moon, theme: serif)
  • Add a two-column layout with :::{.columns}
  • Add a code chunk that produces a plot
  • Add a {.smaller} class to a slide with a lot of text

Where to host slides

Two options, both free:

Method How it works When to use
GitHub Pages Enable in repo settings, serves from a branch Permanent hosting, custom domain
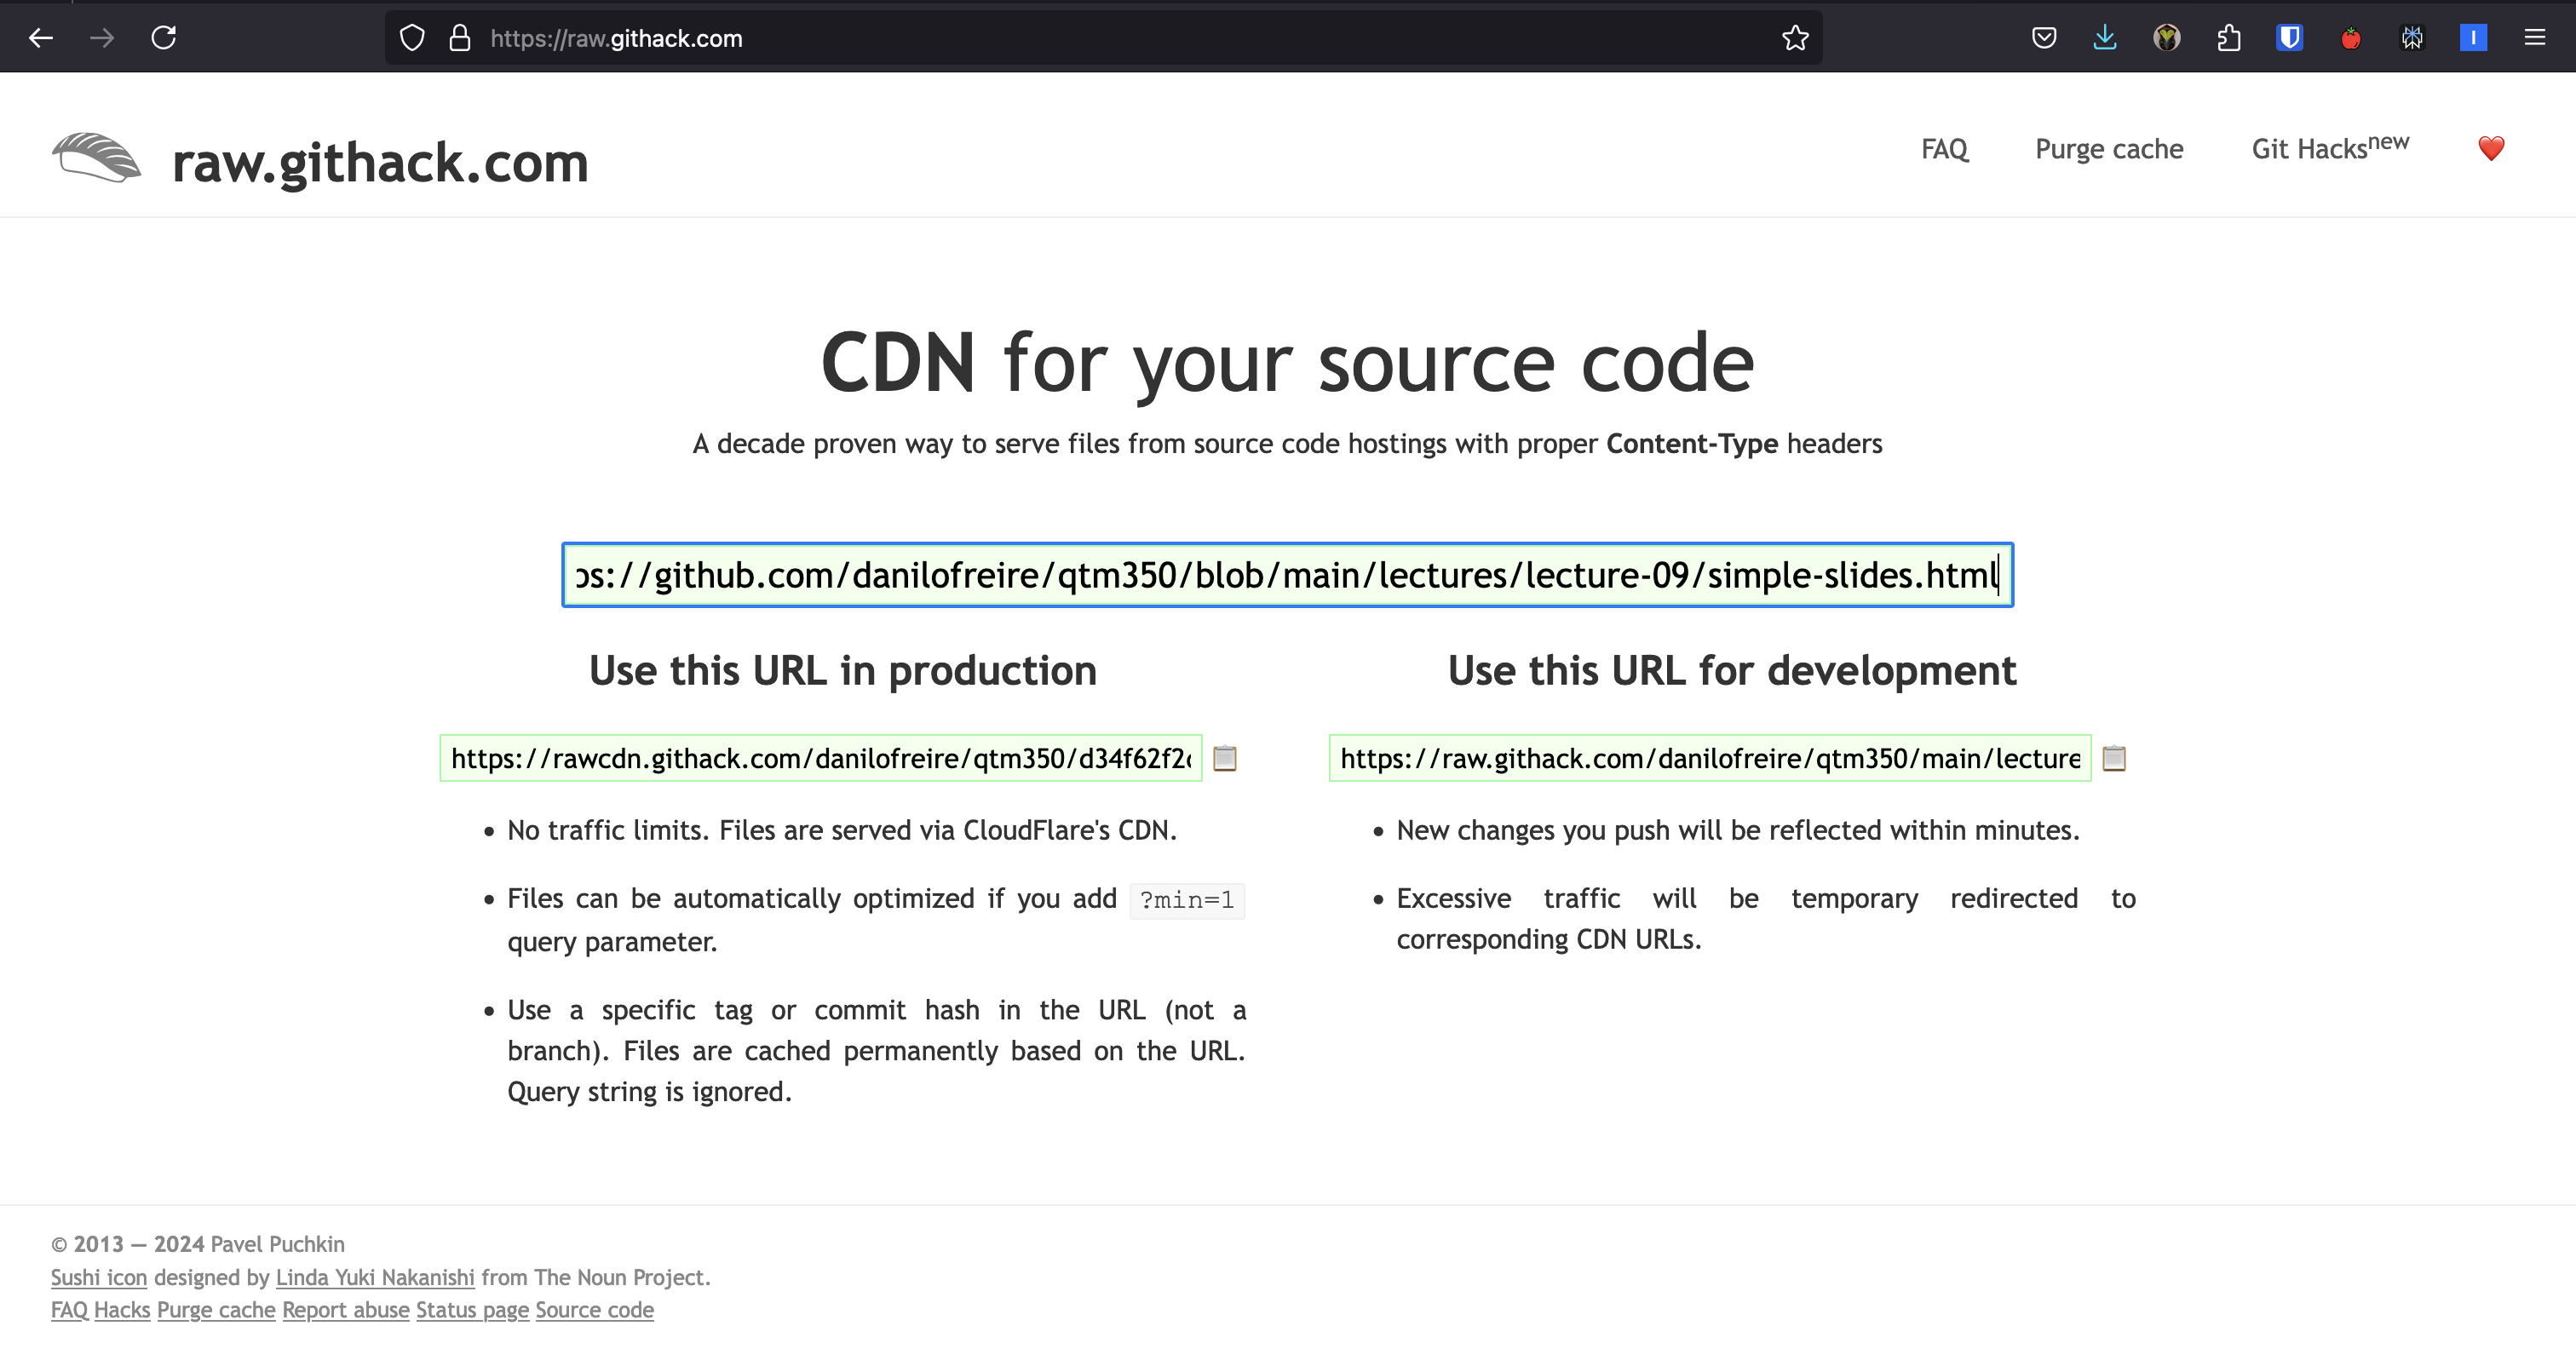
Githack Paste the GitHub link to any .html file Quick sharing, no setup

You met GitHub Pages in module 02. Githack is the fastest path: push your HTML, paste the file URL at raw.githack.com, share the link it returns

Paste the raw GitHub link, get a serveable URL back. The “production” link caches permanently; the “development” link always fetches the latest commit

Websites

  • Quarto websites are static: pre-rendered HTML, CSS, and images, no server-side code
  • Fast to load, free to host, and trivial to version-control
  • Common uses: course sites, project documentation, portfolios, research blogs
  • Free hosting on GitHub Pages, Netlify, or Vercel
  • Limitation: no databases, no login pages, no server-side logic. For those you need a web framework (Flask, Django, etc.)
  • More at quarto.org/docs/websites

The skeleton of a website

Every Quarto website is a folder with the same skeleton:

File Purpose
_quarto.yml Site config: title, navigation, theme
index.qmd Home page (required)
*.qmd Other pages: about, posts, docs
styles.css CSS overrides (optional)
  • Each .qmd becomes one page, with the navigation, footer, and theme inherited from _quarto.yml
  • A page’s own YAML usually holds just its title

The generated _quarto.yml for a new site:

project:
  type: website

website:
  title: "today"
  navbar:
    left:
      - href: index.qmd
        text: Home
      - about.qmd

format:
  html:
    theme: cosmo
    css: styles.css
    toc: true

The theme list has two dozen options, light and dark

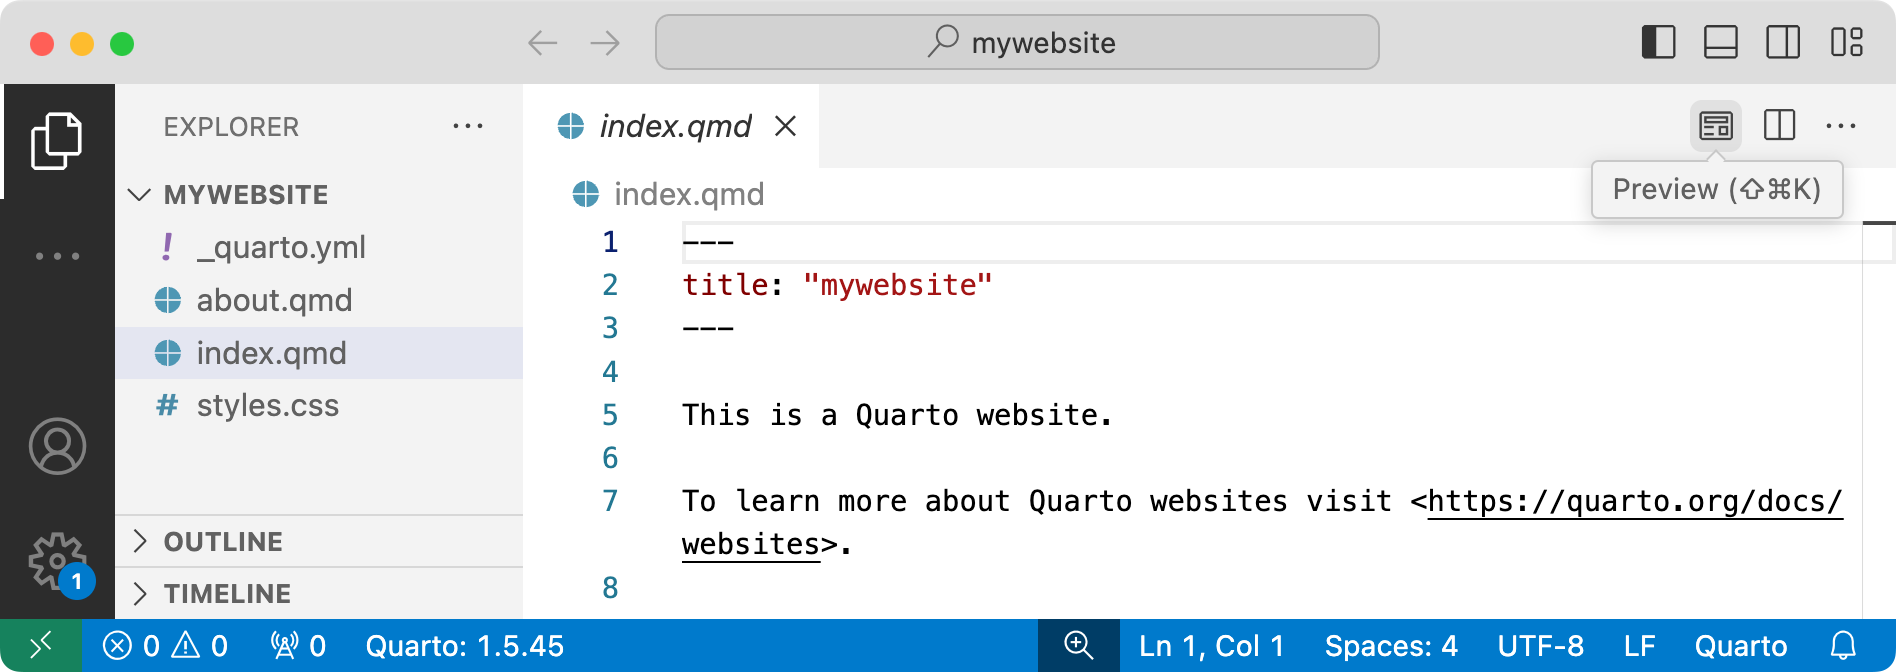
Creating a website in VS Code

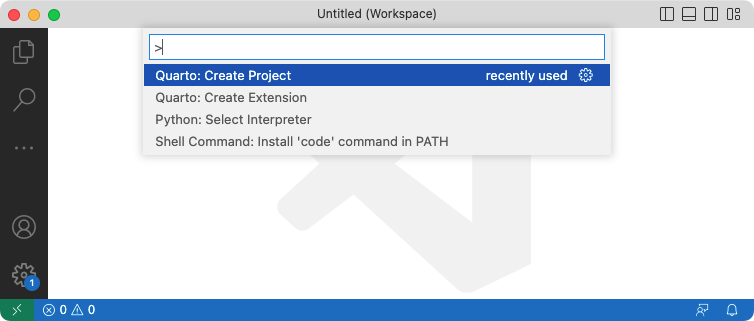
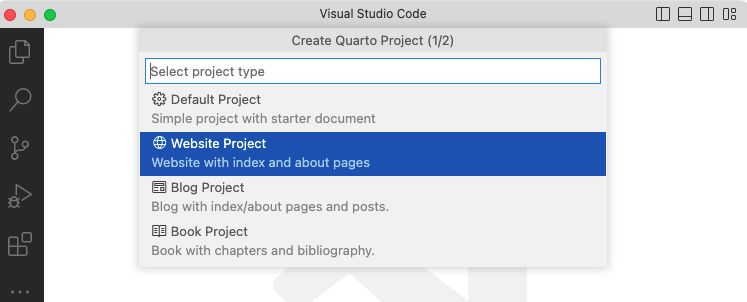
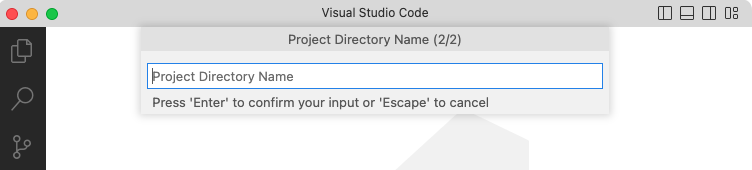
Four steps, clockwise from top left:

  1. Ctrl+Shift+P (or Cmd+Shift+P), then run Quarto: Create Project
  2. Pick Website Project from the list
  3. Choose a new, empty folder for it
  4. The project opens with _quarto.yml, index.qmd, about.qmd, and styles.css. Click Preview to see the site

Click any screenshot to zoom in

Our course website

  • The course site is a Quarto website like the one you just created, plus a longer _quarto.yml
  • The abridged config is on the right: navigation bar, GitHub links, a footer, and paired light and dark themes
  • The full file is on GitHub, and its index.qmd is here
  • Steal from it freely! That is why it is public
project:
  type: website
  output-dir: docs

website:
  title: "DATASCI 350"
  repo-url: https://github.com/danilofreire/datasci350
  navbar:
    left:
      - href: syllabus.qmd
        text: Syllabus
      - href: lectures/lectures.qmd
        text: Lectures
      - href: assignments/assignments.qmd
        text: Assignments
  page-footer:
    left: "Copyright 2026, Danilo Freire."

format:
  html:
    theme:
      light: lumen
      dark: solar
    toc: true

Publishing with one command

Quarto has a built-in publish command for GitHub Pages:

Terminal
quarto publish gh-pages
  • It renders the site, creates or updates a gh-pages branch, pushes it, and GitHub serves the result at https://username.github.io/repo-name/
  • The manual alternative: quarto render, commit the output folder, push, and point Pages at it in the repository settings
  • After the first publish, updating the site is: edit the .qmd, run the command again

Plain text in, public website out!

The freshly published site, straight from quarto publish

One report, many inputs

Parameterised reports

  • You need the same report for ten countries. Or every month. Or for each of thirty students
  • The tempting move is to copy the file ten times and edit each copy. Do not. One mistake now means ten files to fix
  • Write one report with a parameter instead: a value you set from outside the document
  • In Python, a parameter is an ordinary variable in a cell tagged parameters
#| tags: [parameters]
country = "Brazil"
  • That value is the default. Render the file normally and you get Brazil
  • To override it, pass -P in the terminal:
Terminal
quarto render report.qmd -P country:Uruguay
  • The tag is how Quarto finds the cell to replace. Forget it and -P does nothing
  • Put the tagged cell first, above any code that uses the parameter
  • One extra package makes this work, installed once:
Terminal
pip install papermill

If a country name contains a space, quote it:

Terminal
quarto render report.qmd -P country:"United States"

A worked example: report.qmd

---
title: "Country profile"
format: html
jupyter: python3
---

```{python}
#| tags: [parameters]
country = "Brazil"
```

```{python}
#| echo: false
import pandas as pd
import matplotlib.pyplot as plt

profiles = pd.read_csv("data/country_profiles.csv")
one = profiles[profiles["country"] == country]
one = one.sort_values("year")
```

# `{python} country`

This report uses indicators for `{python} country`.

## Life expectancy over time

```{python}
#| echo: false
fig, ax = plt.subplots(figsize=(7, 3.5))
ax.plot(one["year"], one["life_expectancy"])
plt.show()
```
  • The data is real: World Bank indicators for ten countries, 2000 to 2023, in data/country_profiles.csv
  • The parameter does its work in three places: it filters the data, titles the report, and appears in the sentence
  • `{python} country` is inline code. It drops the value of a Python expression straight into your prose
  • So the words change with the data. No heading spells out “Brazil” by hand
  • Only the default names a country. Change it, or pass -P, and the whole document follows
  • The full file is in the lecture folder, a little longer than this extract because it also builds a table

This is the whole trick. One file, one source of truth, many outputs

What it produces

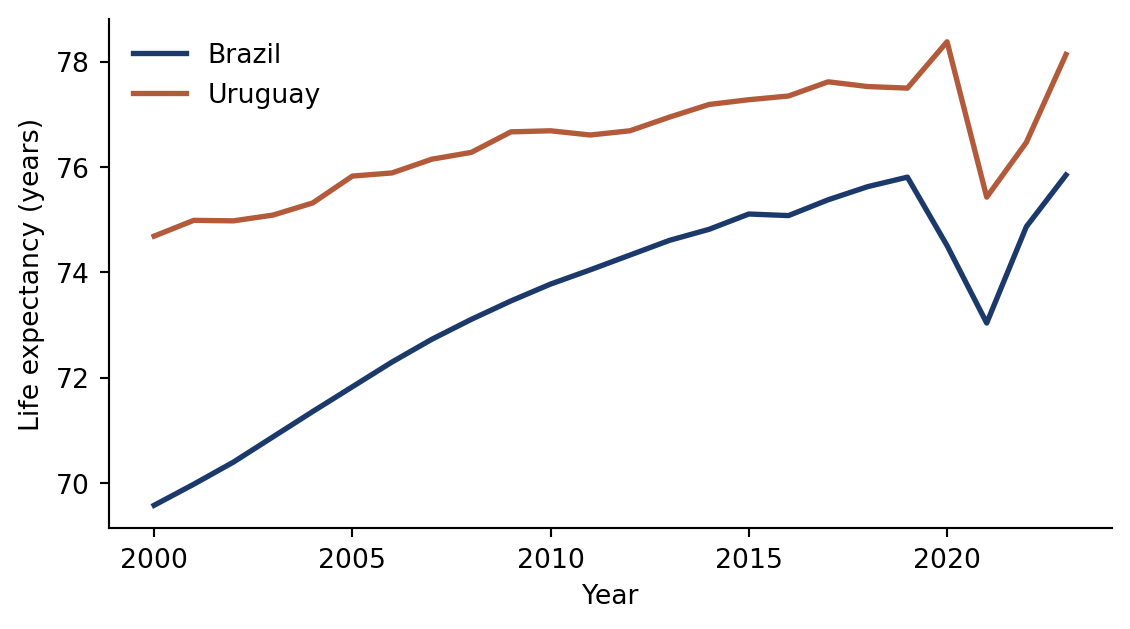
Rendered with the default, country = "Brazil":
Year GDP per capita (US$) Life expectancy
2019 9,030 75.8
2020 7,074 74.5
2021 7,972 73.0
2022 9,281 74.9
2023 10,378 75.8

Two of the ten countries in the file. The report draws one at a time, and the parameter decides which

From one report to a pipeline

One country at a time, each with its own file name:

Terminal
quarto render report.qmd -P country:Uruguay \
  --output profile-Uruguay.html

Or let the shell do all of them, with the loop you met in module 02:

Terminal
for c in Brazil Mexico Uruguay; do
  quarto render report.qmd \
    -P country:$c \
    --output profile-$c.html
done

Three commands you did not have to type, and three files:

profile-Brazil.html
profile-Mexico.html
profile-Uruguay.html
  • Ten countries is the same loop with a longer list. So is a hundred
  • --output matters. Without it, every render writes over report.html
  • Find a mistake, fix one file, run the loop again
  • Industry does exactly this. The only difference is that the loop runs on a schedule instead of on your laptop

This is how one analysis becomes a pipeline!

And it is the shape of your final project: one repository, one analysis, many countries

Try it yourself, again!

You do not have to write the report. Download it and drive it from the terminal.

  1. Download report.qmd and country_profiles.csv (click on the links to get the files)
  2. Put report.qmd in a new folder. Put the CSV in a data folder beside it
  3. Render the file with no options. You get Brazil
  4. Render it again for Japan. Give the output its own file name
  5. Open both HTML files. The heading, the table, and the chart all changed
  6. Render one more country whose name contains a space

Or download both from the terminal:

Terminal
BASE=https://raw.githubusercontent.com/danilofreire/datasci350/main/lectures/lecture-11

curl -O $BASE/report.qmd
mkdir data
curl -o data/country_profiles.csv \
  $BASE/data/country_profiles.csv

Hints:

  • The flag is -P, and it takes name:value
  • Without --output, your second render writes over the first
  • The CSV lists all ten countries. Two of the names contain a space

Solution

When the render fails

Three failures you will meet this term, as they appear on screen:

Terminal
  Cell 1/1: ''...ERROR
ModuleNotFoundError: No module named 'geopandas'
Terminal
ERROR: YAMLException: bad indentation of
a mapping entry (2:14)
 2 | title: Quarto: a first look
------------------^
Terminal
compilation failed- error
Undefined control sequence.
l.172 ...bad command: \(\notarealcommand
  • Python errors read from the bottom. The last line names the problem. The traceback above it only shows how the code got there
  • Quarto tells you which cell broke, so you know where to look first
  • A missing module usually means the package is fine, and Quarto is running a different Python
  • YAML errors read from the top. Trust the caret: line 2, column 14 is the unquoted colon
  • The stack trace printed underneath is noise. Ignore it
  • In LaTeX errors, l.172 is a line in the generated .tex, not in your .qmd
  • The text beside it is yours, though, so search your file for that
  • And render often, so the only new thing is also the broken thing

When Quarto uses the wrong Python

Which Python is Quarto actually running? Ask it:

Terminal
quarto check jupyter

[✓] Checking Python 3 installation....OK
      Version: 3.13.13 (Conda)
      Path: /Users/danilo/miniconda3/bin/python3
      Kernels: ds350, python3

Compare that path with which python3. If they differ, you have found your error. Three fixes:

Terminal
# 1. activate first, render in the same terminal
source .venv/bin/activate
quarto render report.qmd

# 2. point Quarto at one interpreter
QUARTO_PYTHON=~/.venv/bin/python \
  quarto render report.qmd
# 3. name a kernel in the document itself
jupyter: ds350
  • The symptom never changes: ModuleNotFoundError for a package you know you installed
  • Quarto does not inherit your Python. It picks one, in a fixed order
  • QUARTO_PYTHON first, if it is set. Otherwise whatever python3 means on your PATH
  • Fix 3 is the most reproducible. The choice lives in the document, so it travels with the file
  • jupyter kernelspec list shows your kernels. Add the current environment with:
Terminal
python -m ipykernel install --user --name ds350

In VS Code, the Render button runs in its terminal, not yours. The kernel you picked in a notebook does not follow it there

Summary: where this leaves you

Take stock for a moment. As of today, you can build:

  • An article with formatted citations and numbered figures, in HTML and PDF, from one plain-text file
  • A _freeze/ folder that pins your results until you decide to change them
  • Slides and a public website, online with quarto publish gh-pages
  • One parameterised report that a shell loop turns into ten reports

And you know why each one earns its place:

  • freeze: auto separates “I changed the code” from “the world changed”
  • Labels and @ references mean nothing is numbered by hand
  • A website is just a folder with a _quarto.yml in it
  • Everything today was plain text, so everything today lives in Git

That is the toolkit your final project is built with. Module 06 adds scripted data collection, and module 08 pins the environment underneath. You’re ready to go!

Next class

  • We change gears: local language models
  • How large language models actually work, in enough depth to predict their failures
  • A trained model turns out to be a file you can download, so we take one apart and read every setting inside it
  • Then you build a chatbot with a personality of your own choosing
  • Install Ollama before class and run ollama pull llama3.2:1b. The download is 1.3 GB, and the classroom wifi cannot do that twenty-five times at once
  • Bring the scepticism you built this week: it transfers

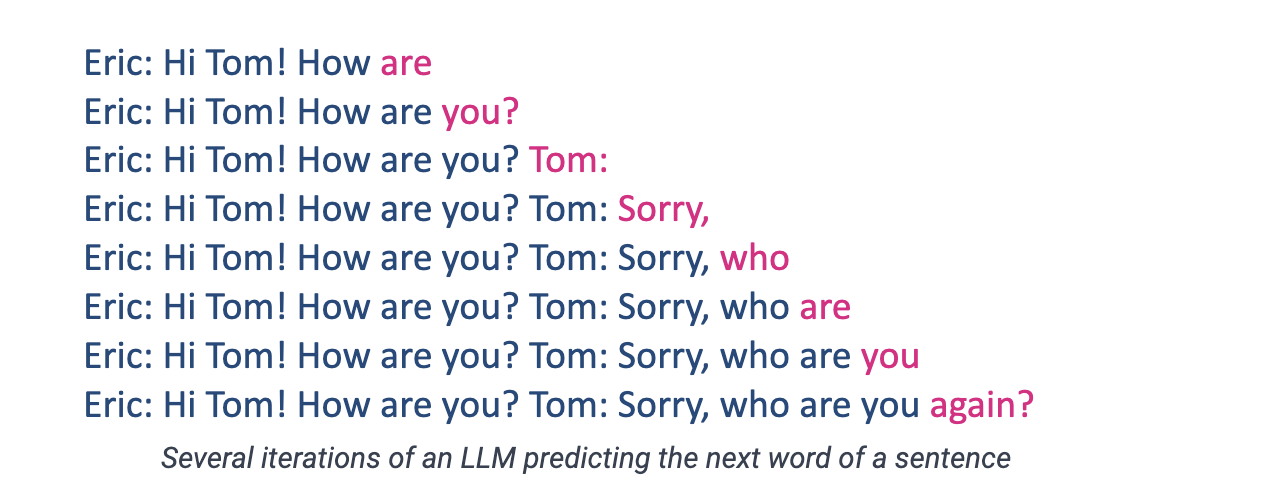
Everything a language model does, in one picture: guess the next word, then guess again

Additional materials

And now you know what Quarto can do! 😎

That’s all for today! 🎉

Appendix 01: Solution to the first exercise

The complete practice.qmd:

---
title: "My Quarto Document"
subtitle: "A simple example"
author: "Danilo Freire"
date: "2026-09-30"
format: html
bibliography: references.bib
---

# Introduction

This is a simple Quarto document.
This is @fig-sine.

```{python}
#| echo: true
#| eval: true
#| fig-cap: "Sine function"
#| label: fig-sine

import matplotlib.pyplot as plt
import numpy as np

x = np.linspace(0, 10, 100)
y = np.sin(x)

plt.plot(x, y)
plt.xlabel("x")
plt.ylabel("sin(x)")
plt.title("Figure 01")
plt.show()
```

Render with:

Terminal
quarto render practice.qmd
quarto render practice.qmd --to pdf

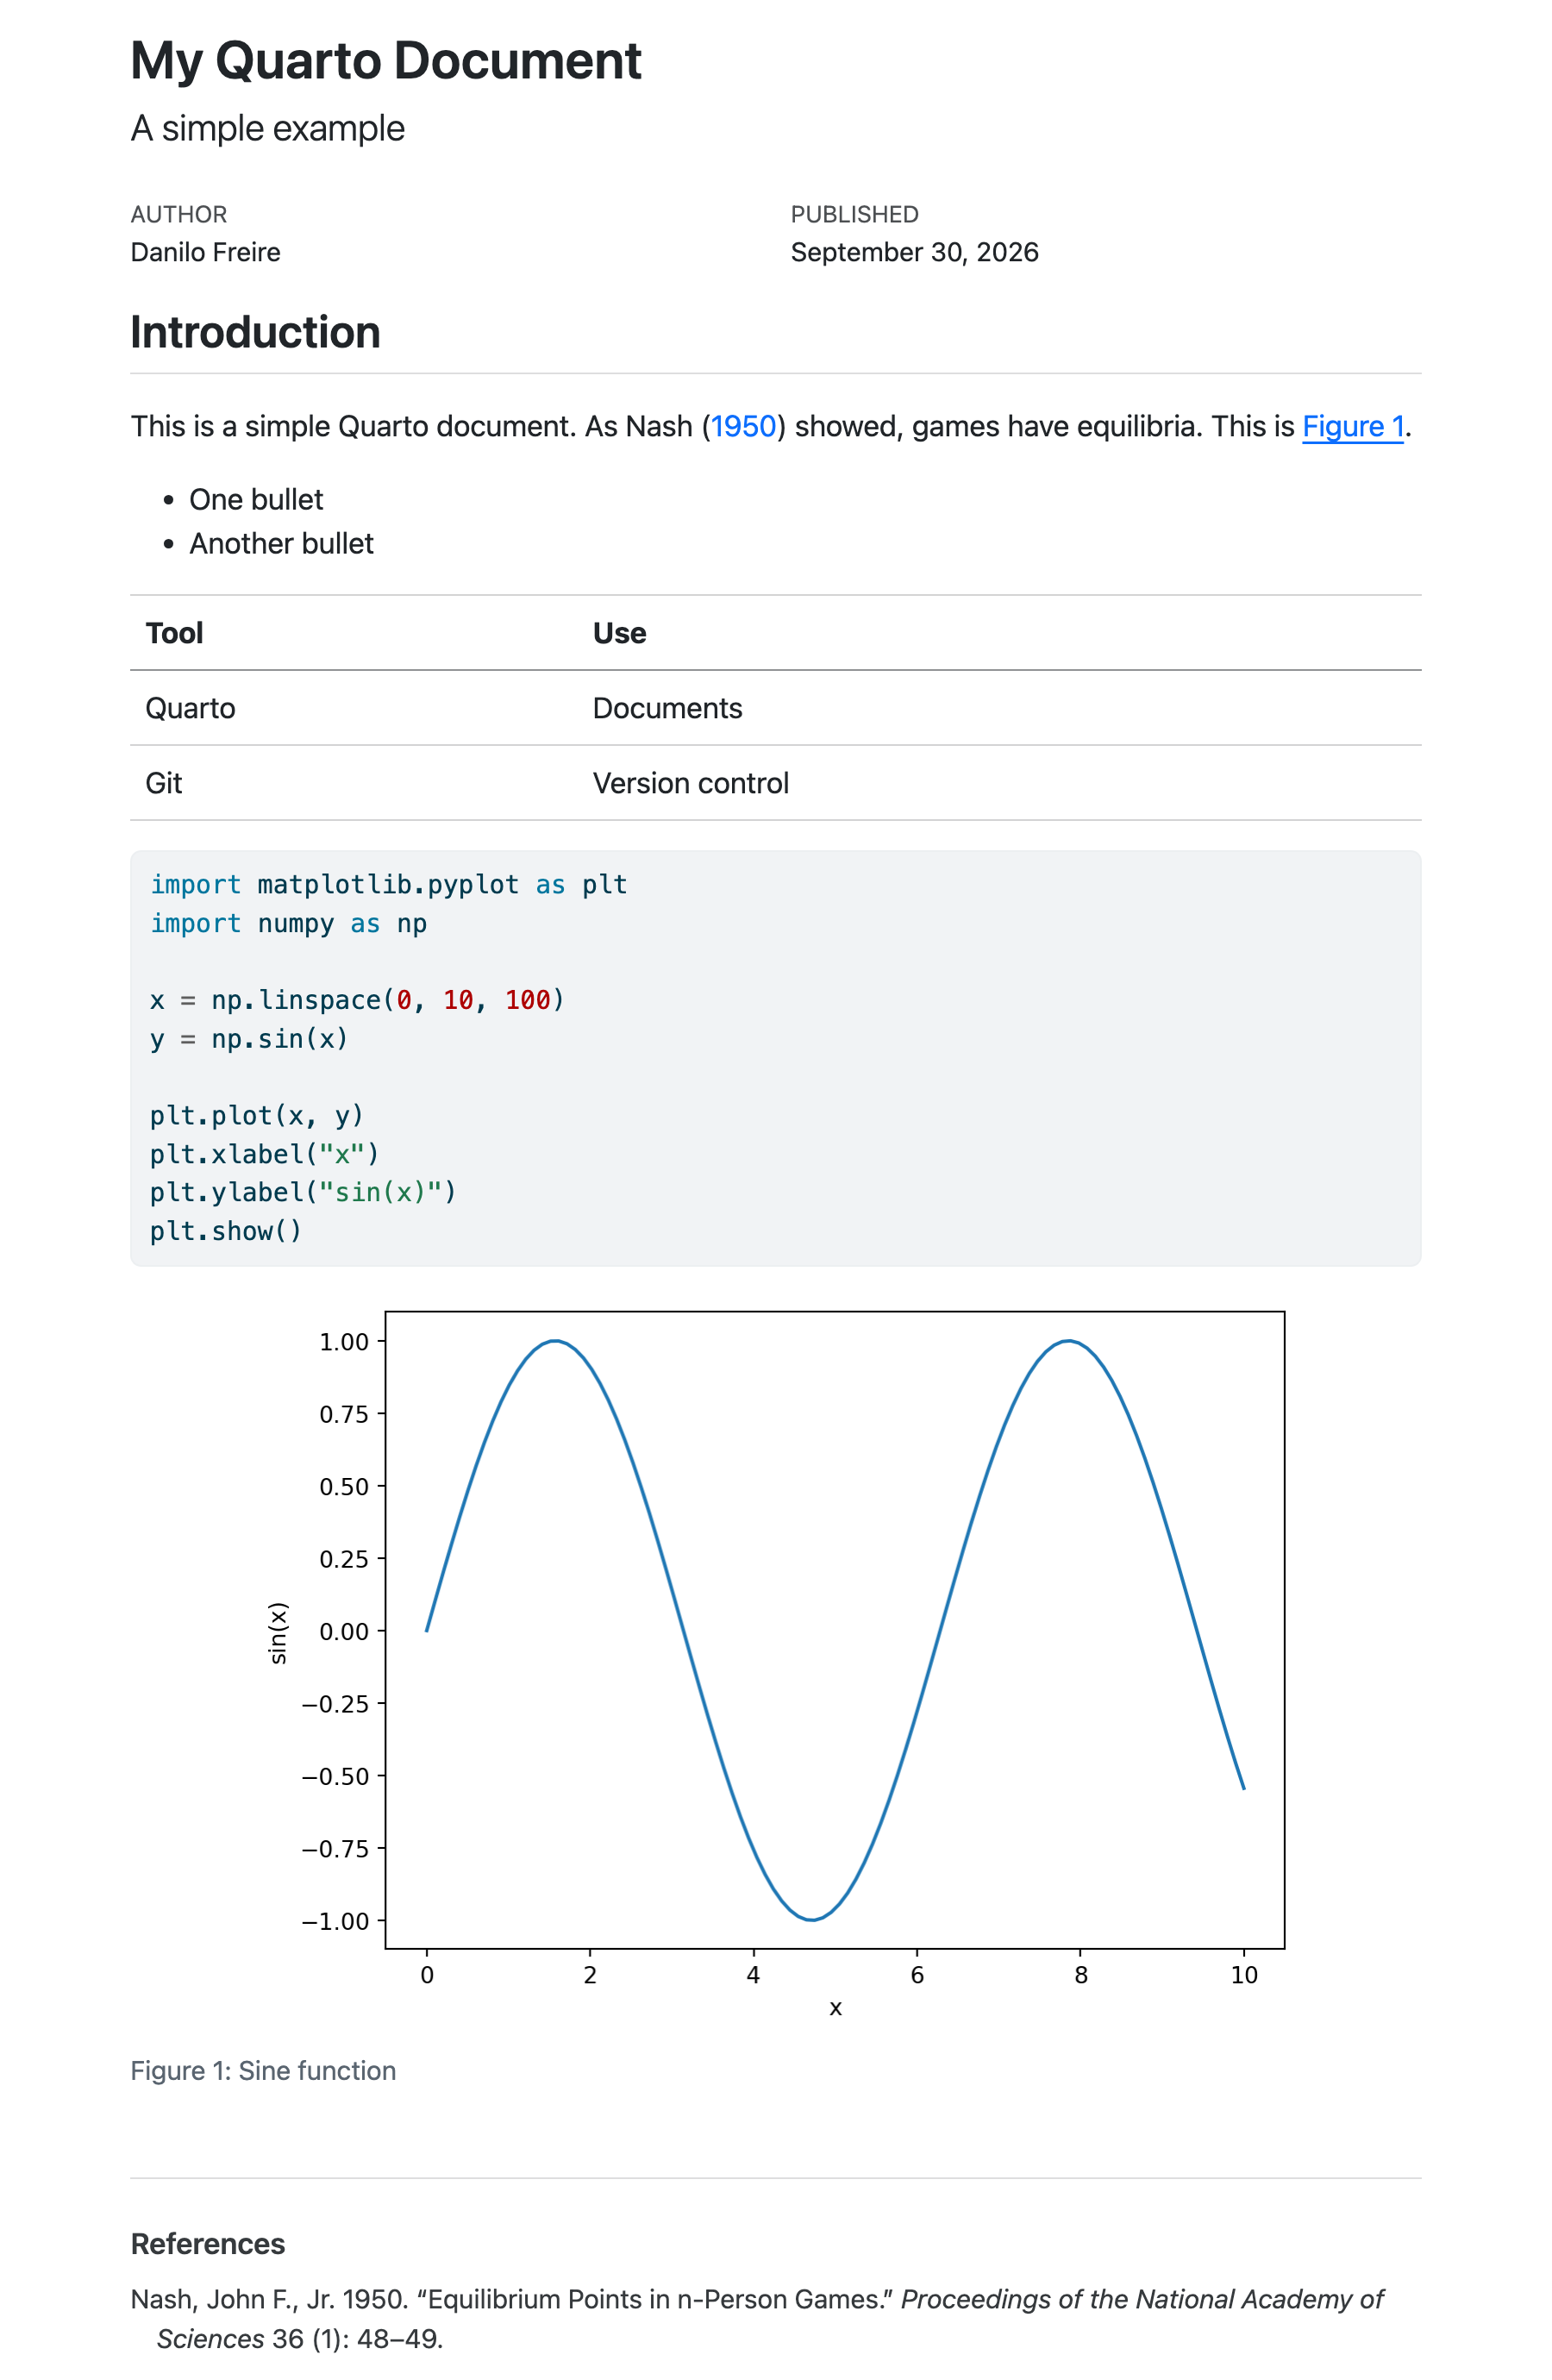
The rendered output:

Key points:

  • #| label: fig-sine gives the figure a cross-reference label
  • @fig-sine in the text creates a clickable link to it
  • bibliography: references.bib tells Quarto where to find BibTeX entries
  • @key cites from the .bib file; the reference list is added automatically at the end

Back to main text

Appendix 02: Solution to the second exercise

Your folder should look like this before you render anything:

country-report/
├── report.qmd
└── data/
    └── country_profiles.csv

Steps 3 to 6, in order:

Terminal
quarto render report.qmd

quarto render report.qmd \
  -P country:Japan \
  --output profile-Japan.html

quarto render report.qmd \
  -P country:"South Africa" \
  --output profile-South-Africa.html

Three things worth noticing:

  • The first render writes report.html, and it says Brazil, because that is the default in the tagged cell
  • Without --output, every render writes over report.html. The Japan version would have replaced the Brazil one
  • South Africa needs quotes. Without them the shell splits the name in two, the filter matches nothing, and the render stops with a ValueError

Nothing above edits the report. You changed the output by changing the input, which is the point of a parameter

If you want to go further, change the default from Brazil to India, render with no options, and watch the same file rebuild for a different country

Back to main text