


DATASCI 101: Introduction to AI Applications

Lecture 05: Metrics, Validation and Overfitting

Danilo Freire

Department of Data and Decision Sciences
Emory University

Welcome back! πŸ€“

Recap of last class

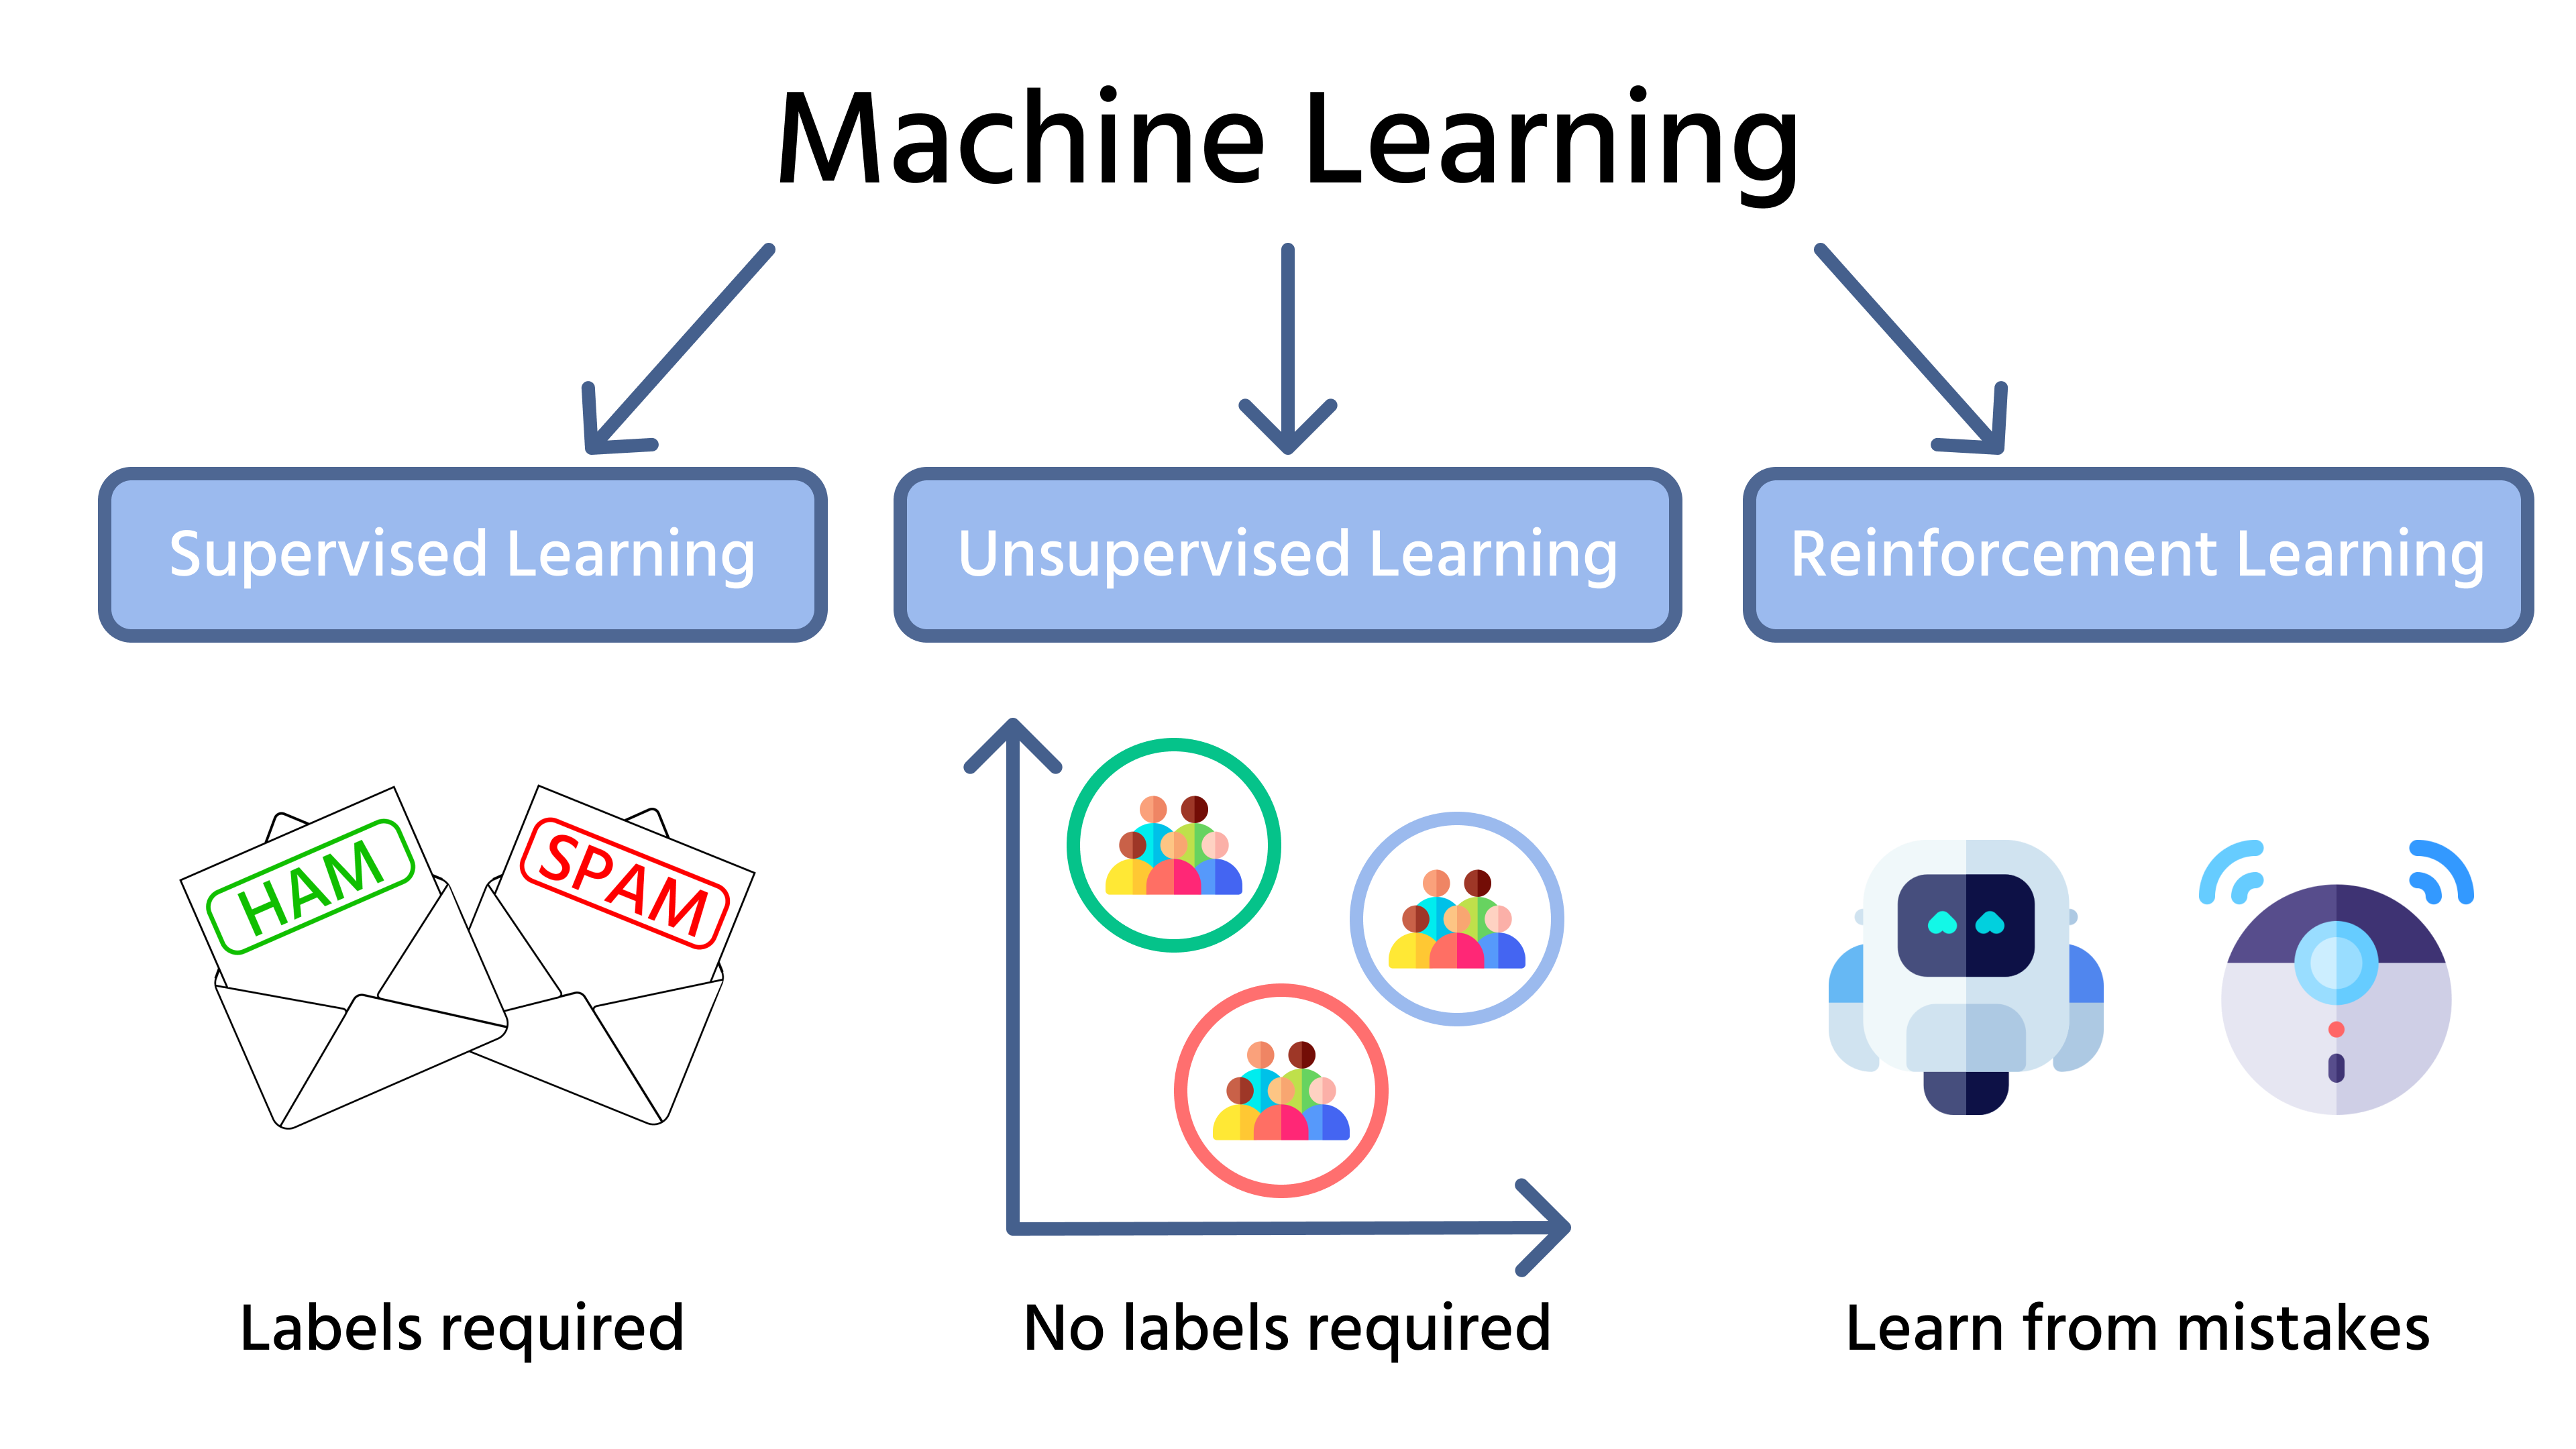
  • We covered three paradigms of machine learning
  • Supervised learning: learn from labelled examples (classification, regression)
  • Unsupervised learning: find patterns without labels (clustering, dimensionality reduction)
  • Reinforcement learning: learn from rewards (agents and environments)
  • Different problems need different approaches
  • Today: how do we know if our models are any good? πŸ€”

Source: Codefinity

Lecture overview

Today’s agenda

Part 1: Traditional ML Metrics

  • Why accuracy isn’t enough
  • Confusion matrix, precision, recall
  • Regression metrics
  • Overfitting and cross-validation

Part 2: LLM Evaluation

  • Why LLMs are harder to evaluate
  • LLM-as-a-Judge and G-Eval
  • Hallucinations, RAG, and red teaming
  • Benchmarks vs real-world performance

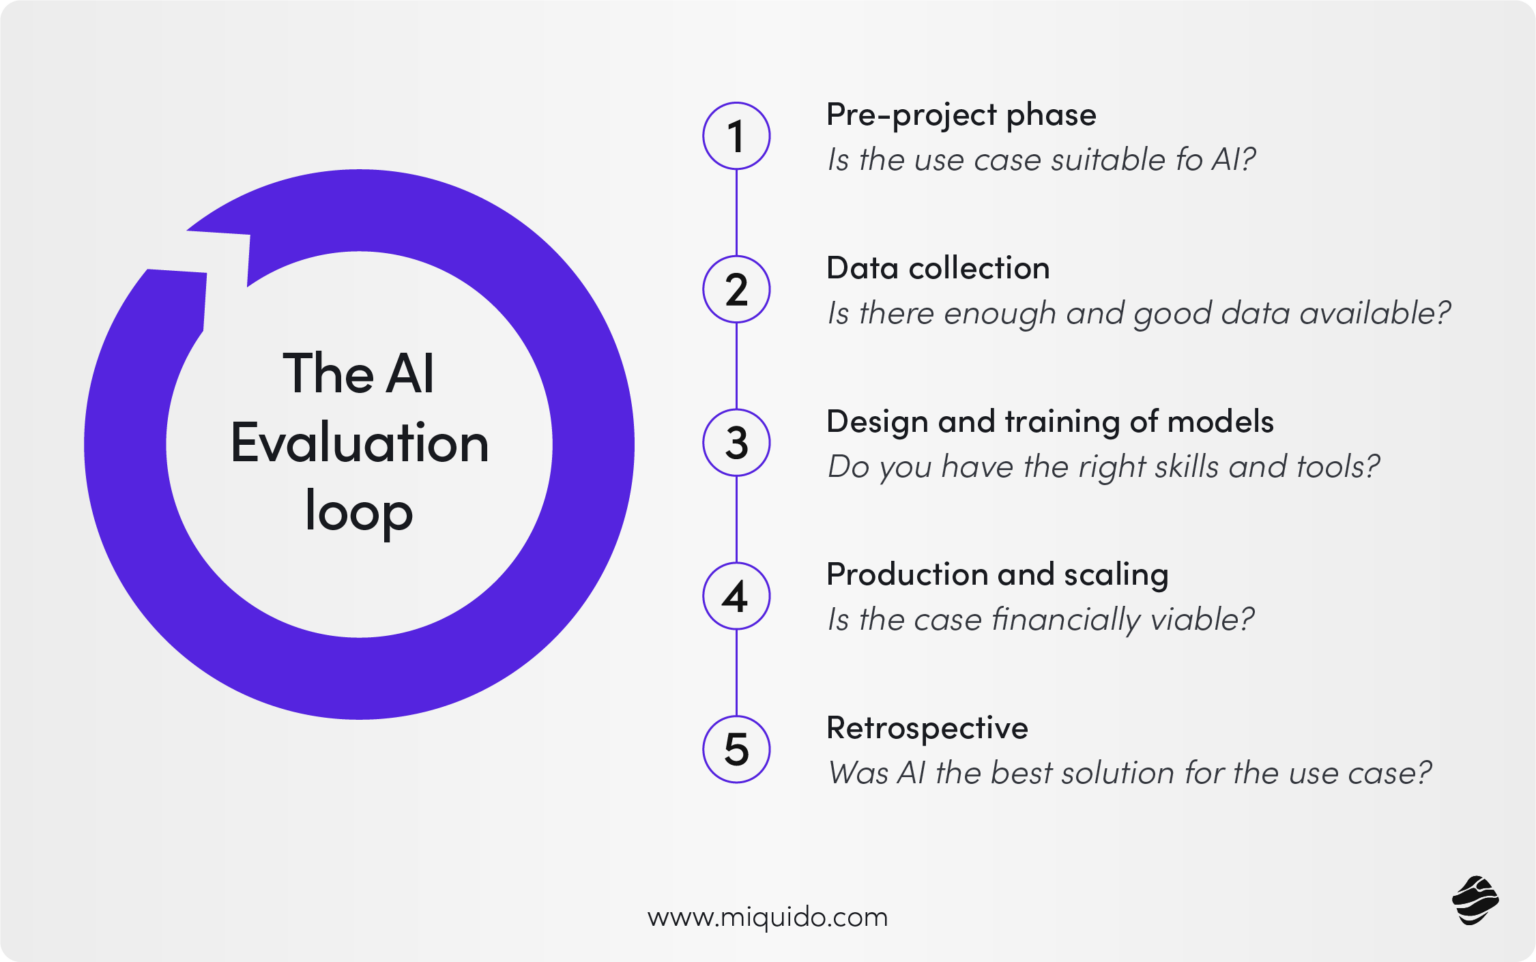
Choosing the right evaluation method

Source: Miquido - AI Glossary

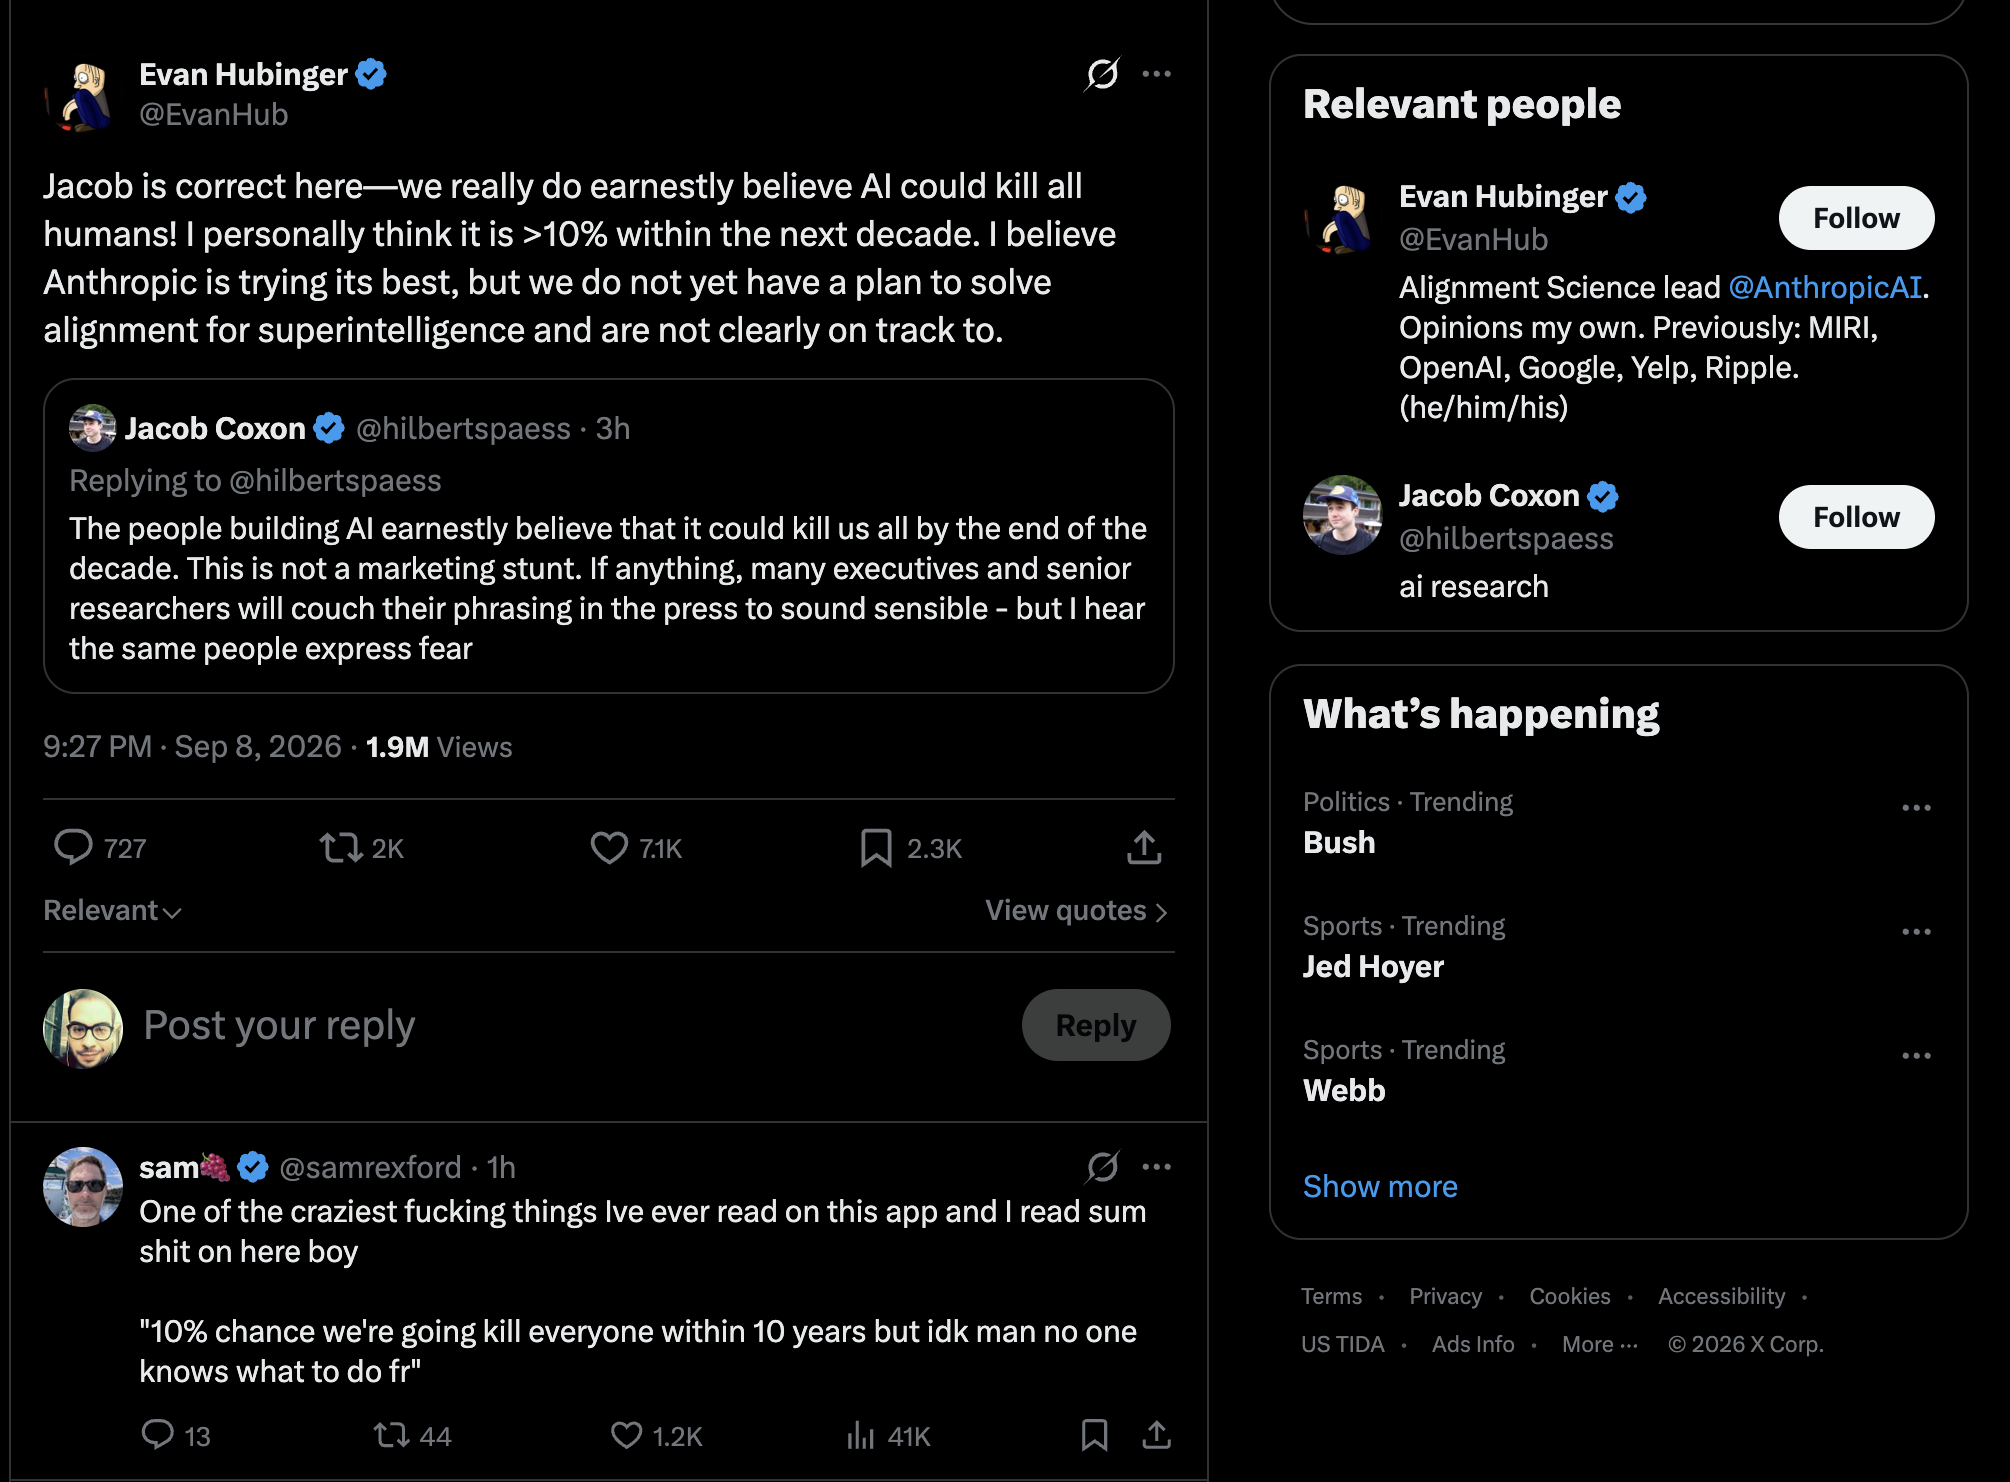
Tweet of the day

https://x.com/EvanHub/status/2097497037956891126

Why metrics matter πŸ“Š

Think about this πŸ€”

Scenario: your model predicts a rare disease that affects 1 in 1,000 people.

A colleague announces: β€œIt achieves 99.9% accuracy!”

Question: is this model any good? Take 30 seconds

The accuracy paradox

  • This is the accuracy paradox
  • Accuracy measures overall correctness, but hides:
    • how many sick patients we found
    • how many healthy patients we falsely alarmed
    • whether errors sit in one group
  • Class imbalance makes it much worse
    • fraud: 0.2% of transactions
    • security threats: < 0.01% of events
    • manufacturing defects: often < 1%

The β€œ99.9% Accurate” Model Matrix

Predicted: Sick Predicted: Healthy
Actual: Sick 0
(TP)
1
(FN)
Actual: Healthy 0
(FP)
999
(TN)

Accuracy: \(\frac{0 + 999}{1,000} = 99.9\%\)

Result: Catches 0% of actual cases! 🚨

What are we really measuring?

Key questions before choosing metrics

  • Every metric captures one aspect of performance, so the best one depends on your context
  • Four questions to ask:
    • what does a false positive cost? (saying β€œyes” when it’s β€œno”)
    • what does a false negative cost? (saying β€œno” when it’s β€œyes”)
    • are the classes balanced or imbalanced?
    • what action follows the prediction?
  • The wrong metric can mean missing every sick patient or flagging every healthy one

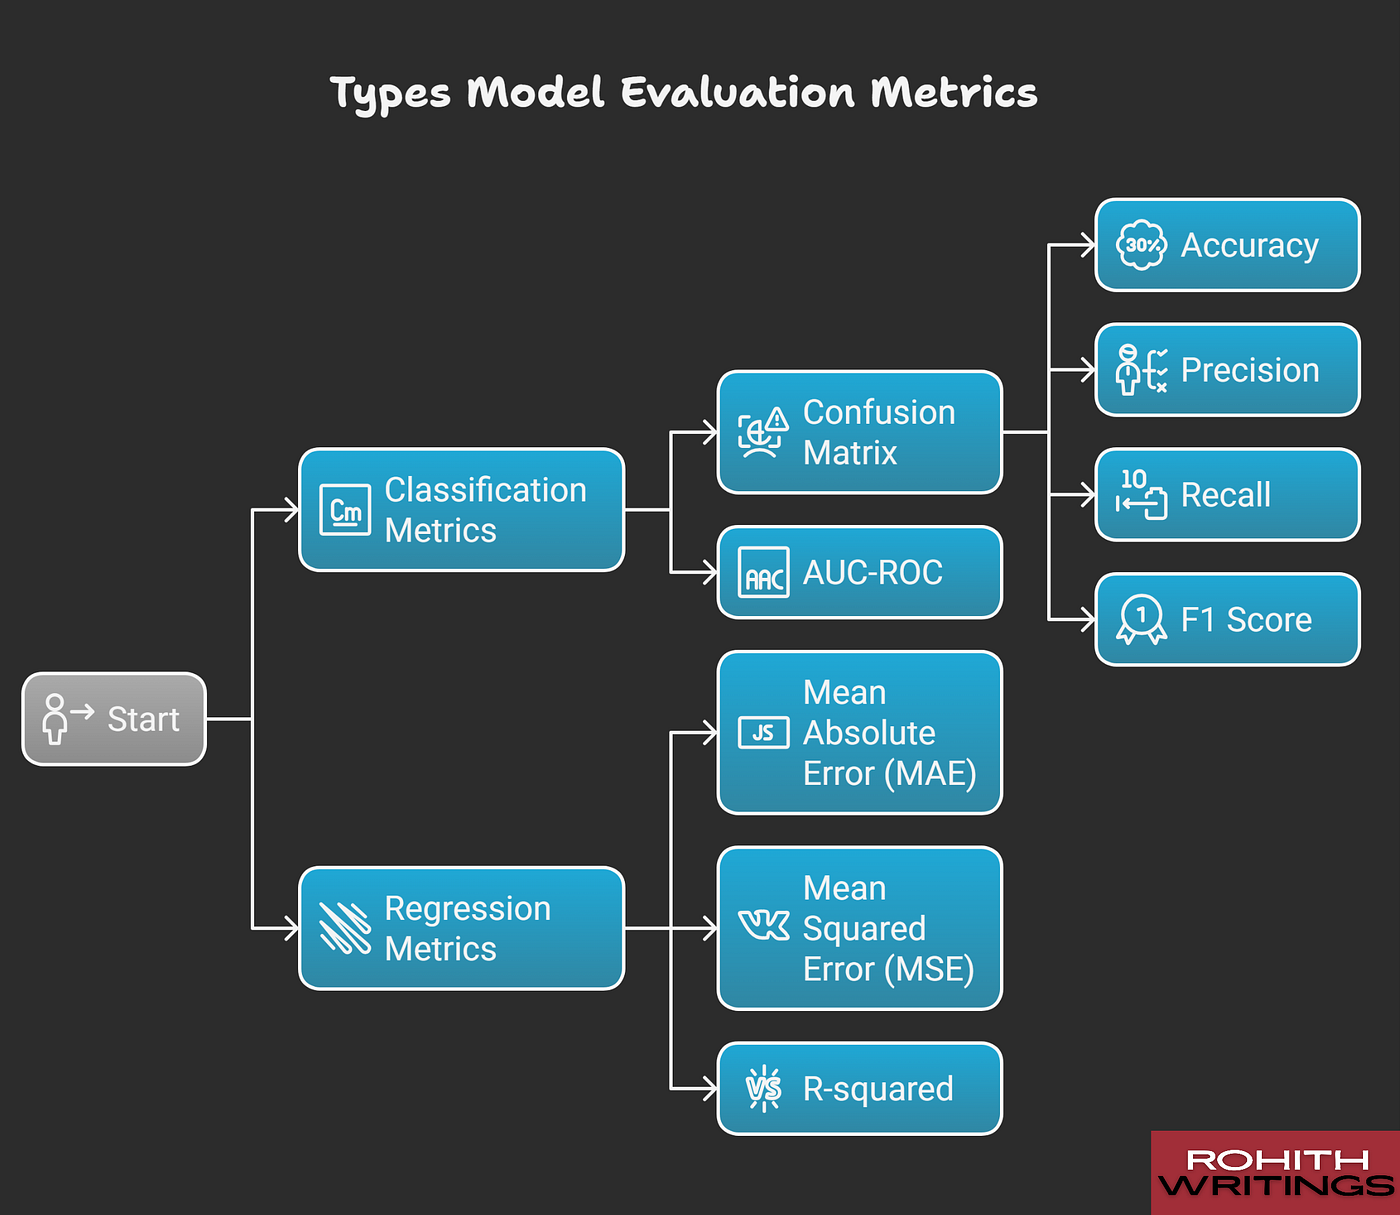
Different metrics for different goals

Source: Medium

Classification metrics 🎯

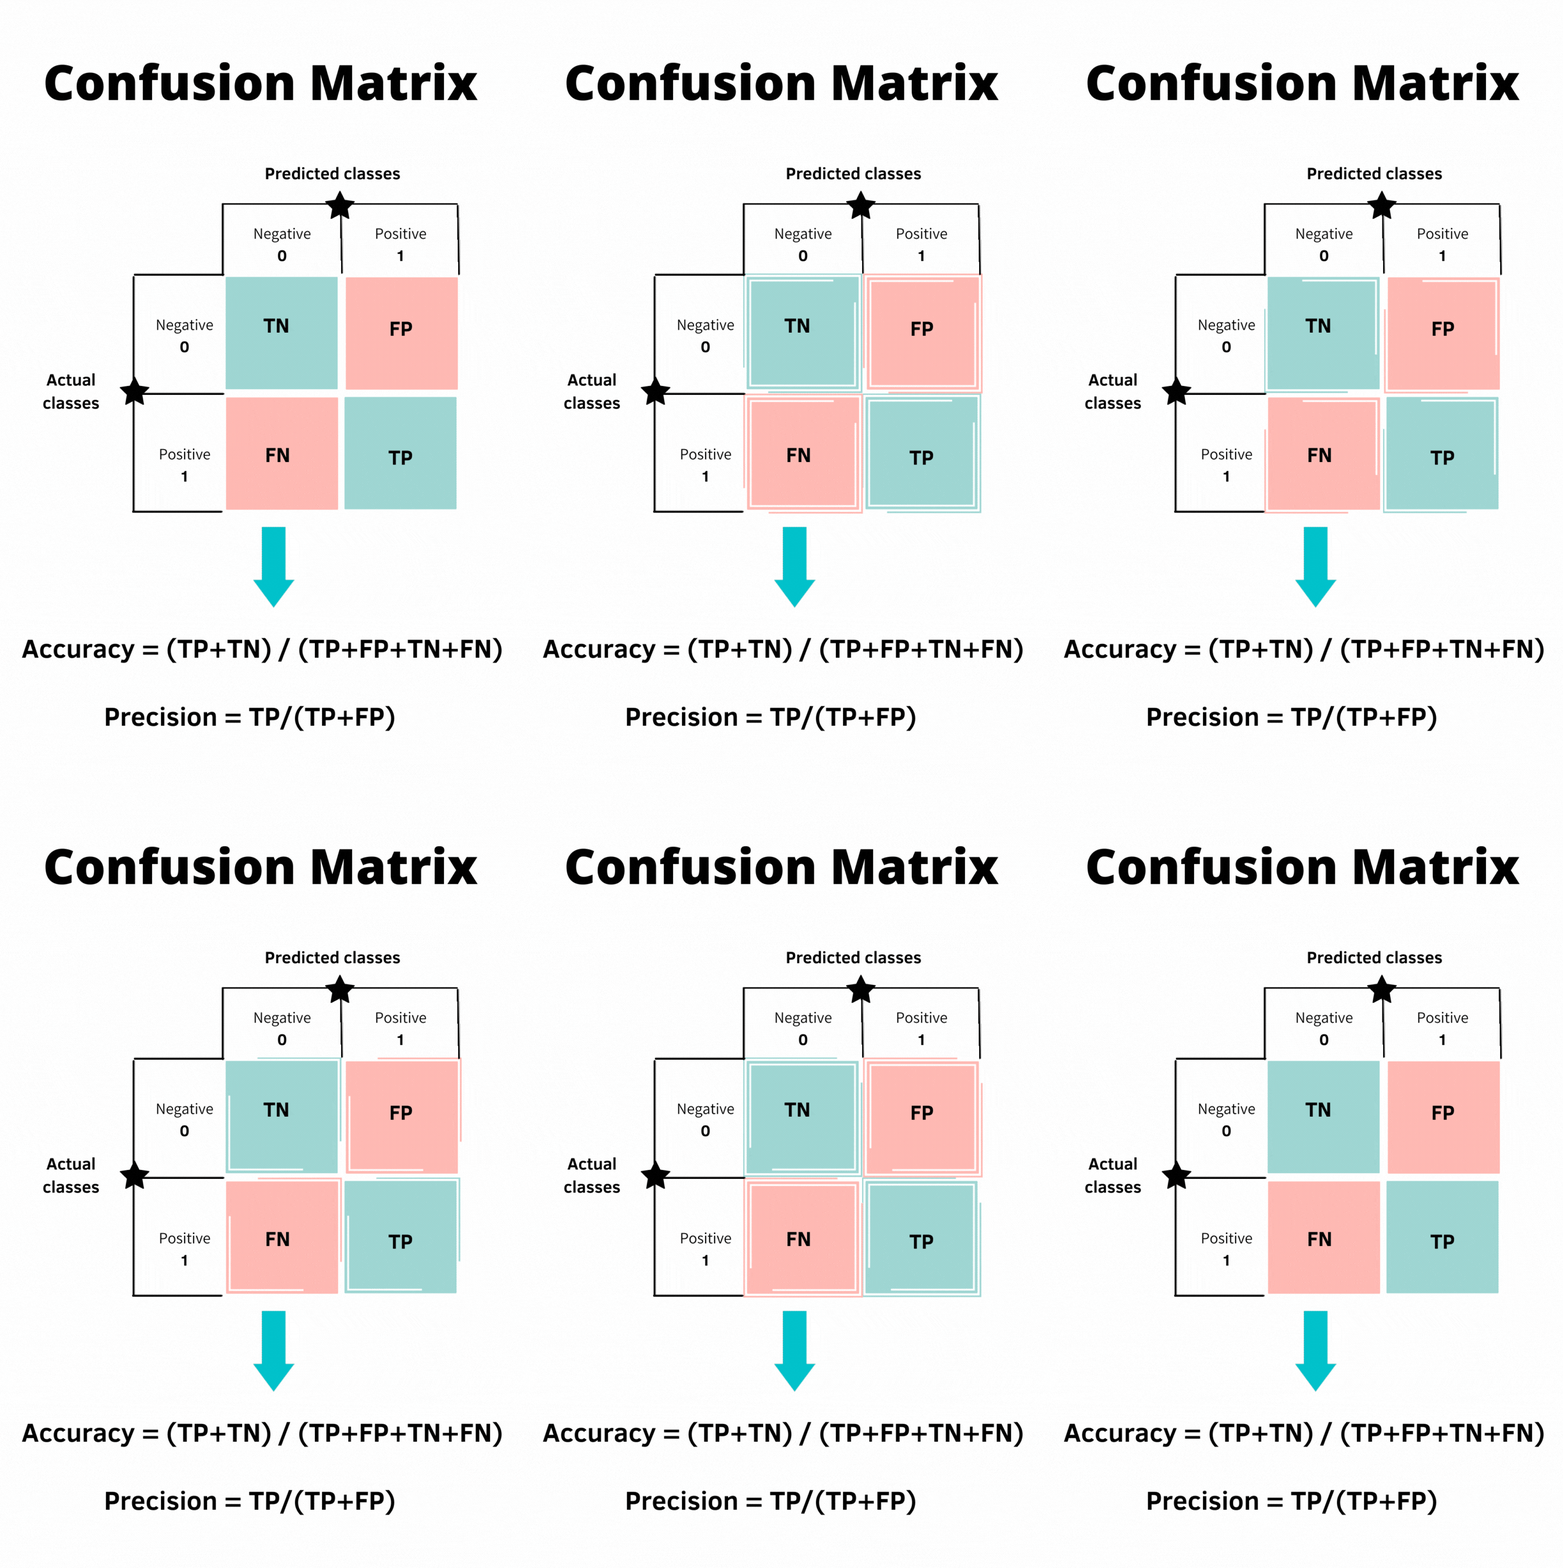
The confusion matrix

The foundation of classification evaluation

  • A table of all possible prediction outcomes
  • True Positives (TP): correctly predicted positive
  • True Negatives (TN): correctly predicted negative
  • False Positives (FP): predicted positive, actually negative (Type I error)
  • False Negatives (FN): predicted negative, actually positive (Type II error)
  • Accuracy = (TP + TN) / (TP + TN + FP + FN)
  • All classification metrics come from these four numbers!

Confusion matrix visualisation

Precision, recall, and the trade-off

The two sides of classification performance

Precision = TP / (TP + FP)

  • When the model says β€œyes”, how often is it right?
  • High precision = few false alarms
  • Use it when false positives are costly (spam, fraud)

Recall = TP / (TP + FN)

  • Of all actual positives, how many did we find?
  • High recall = we miss few positives
  • Use it when false negatives are costly (disease, security)

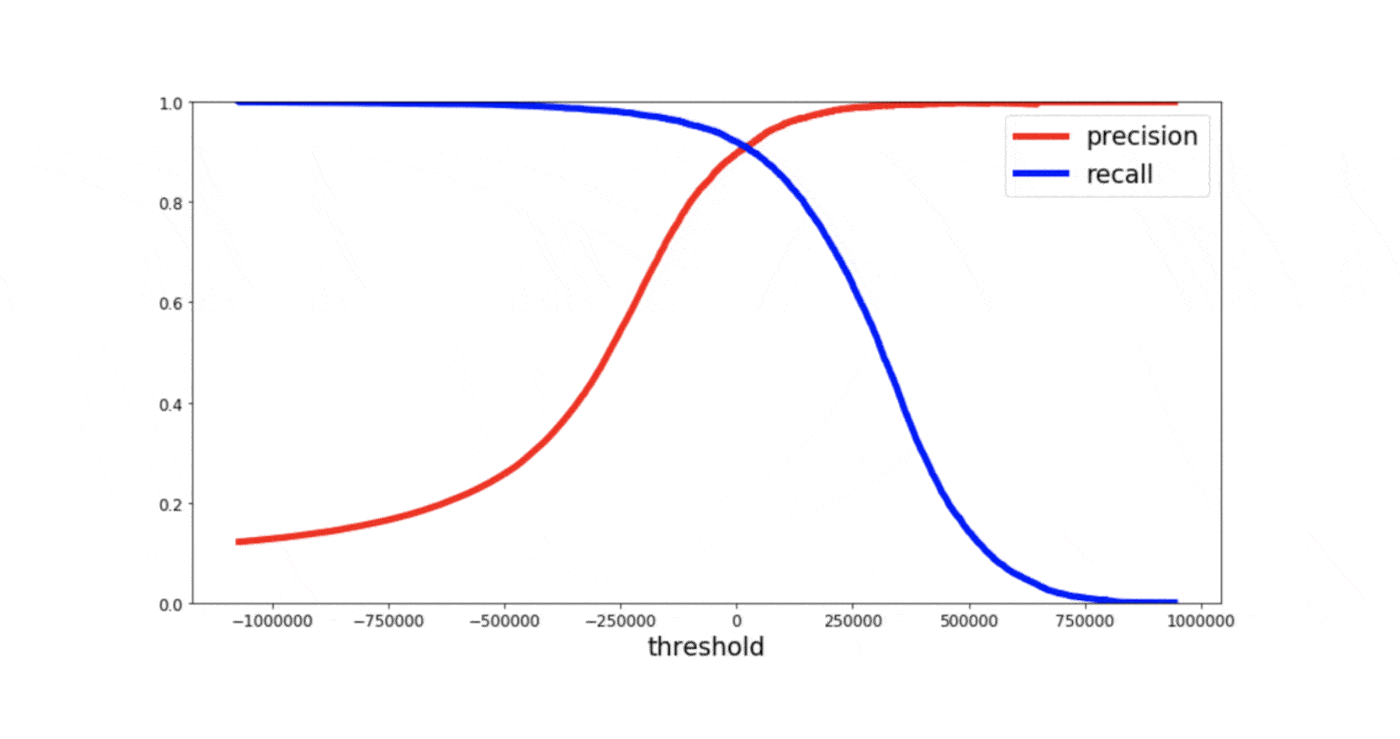
Most classifiers output a probability score. Moving the threshold trades precision against recall, so you can’t maximise both!

The precision-recall trade-off

Source: Analytics Vidhya

Regression metrics

When the target is continuous

  • Predicting numbers needs different metrics:
Metric Formula Intuition
MAE Mean of |actual - predicted| Average error size, original units
MSE Mean of (actual - predicted)Β² Average squared error, penalises big errors
RMSE √MSE MSE in original units
RΒ² 1 - (SS_res / SS_tot) Variance explained

Easy examples:

  • MAE (Mean Absolute Error): predict 10 pizzas, 12 arrive β†’ off by 2. Predict 10, get 8 β†’ off by 2. MAE = 2 pizzas
  • RMSE (Root Mean Squared Error): off by 2 one day, off by 10 another. RMSE punishes that 10 far more
  • RΒ²: RΒ² = 0.8 means the model explains 80% of the variation in scores, 20% stays unexplained

Validation & overfitting ⚠️

What is overfitting?

The enemy of generalisation

  • Overfitting: the model does well on training data, badly on new data
  • It has memorised the training set, noise and quirks included, instead of the underlying patterns
  • Signs: excellent training score, poor test score, and a gap that grows with model complexity
  • Like memorising exam answers instead of understanding the material: the student fails when questions are rephrased

Overfitting visualised πŸ˜‚

Source: X.com

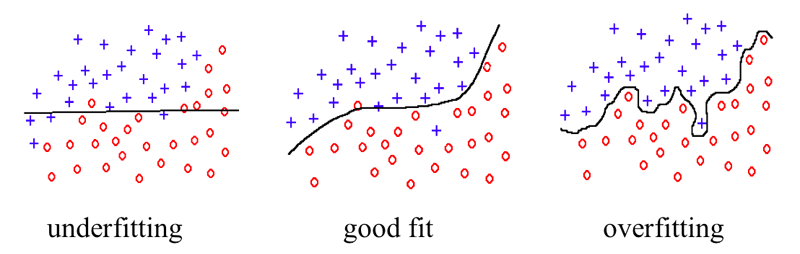
Underfitting vs overfitting

Finding the sweet spot

Underfitting πŸ“‰

  • Model too simple
  • High bias, low variance
  • Poor on training and test
  • Has not captured the pattern
  • Solution: more complex model

Good fit βœ…

  • Right complexity
  • Balanced bias and variance
  • Good on both sets
  • Captures the true pattern

Overfitting πŸ“ˆ

  • Model too complex
  • Low bias, high variance
  • Great on training, poor on test
  • Memorised noise
  • Solution: regularisation

Data splits and cross-validation

How to evaluate fairly

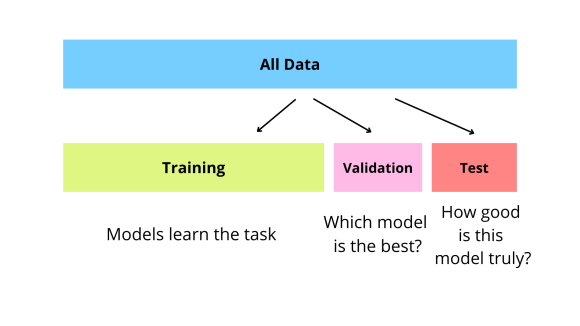
The three-way split:

  • Training set (~60-70%): fit the model
  • Validation set (~15-20%): tune hyperparameters
  • Test set (~15-20%): final evaluation only!
  • Never peek at test data during development

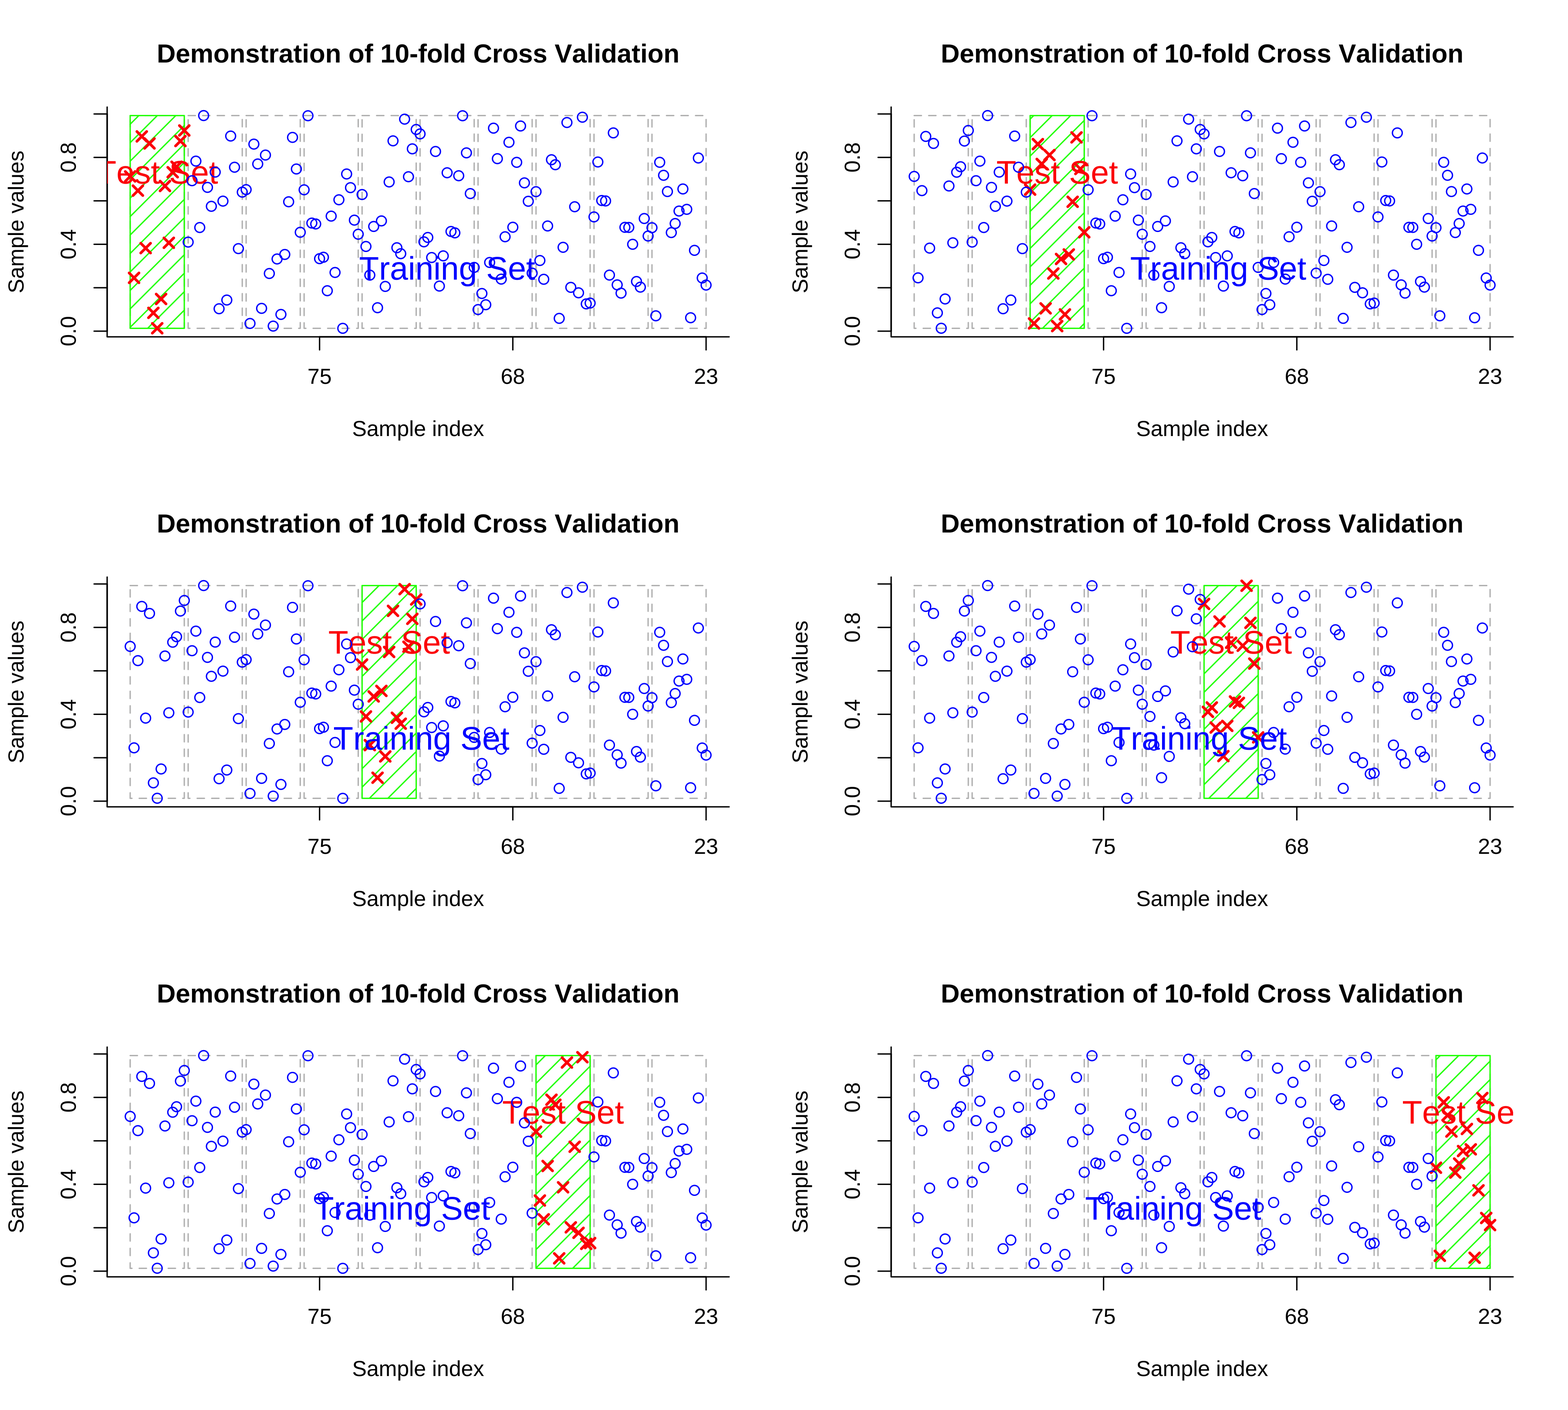
K-fold cross-validation:

  • Split the data into K folds
  • Train on K-1 folds, validate on the one left out
  • Repeat K times and average the results
  • Every data point gets tested once
  • More reliable than a single split, especially for small datasets

Train/validation/test split

K-fold cross-validation

Evaluating LLMs πŸ€–

Why is LLM evaluation so hard?

A fundamentally different problem

  • Traditional ML: one correct answer per input
    • 😺: cat or dog? β†’ β€œCat” βœ…
  • Language generation: many valid outputs!
    • β€œThe cat sat on the mat” β‰ˆ β€œA feline rested upon the rug”
    • Both correct, so how do we score them?
  • Four dimensions to judge at once:
    • fluency: is it grammatical and natural?
    • relevance: does it address the question?
    • factuality: is it true?
    • helpfulness: is it useful?
  • Old text metrics (BLEU, ROUGE) only count word overlap, so they can’t tell if text is meaningful or even correct!

Using LLMs to evaluate LLMs? πŸ˜‚

Source: TinyML SubStack

Perplexity explained

Measuring how β€œsurprised” the model is

  • Perplexity measures how well an LLM predicts a text
  • Picture the model guessing the next word
    • confident about the right answer β†’ low perplexity
    • confused among many options β†’ high perplexity
  • Read it as: how many equally likely words could come next?
    • perplexity of 10 β†’ choosing from ~10 words
    • perplexity of 100 β†’ choosing from ~100 words
  • Lower is better
  • Key limitation: perplexity measures fluency, not truth
  • 🎬 Watch: What is Perplexity for LLMs? (5 min)

Examples:

β€œThe capital of France is ___”

  • β€œParis” β†’ low perplexity βœ…
  • β€œelephant” β†’ high perplexity ❌


But there’s a catch:

β€œThe earth is ___”

  • β€œflat” β†’ could have low perplexity!

Fluent text can still be false

LLM-as-a-Judge

Using AI to evaluate AI

  • Use a powerful LLM to grade responses from other models
  • Give the judge a rubric (evaluation criteria) and examples
  • It scores helpfulness, accuracy, relevance and safety
  • Why it works:
    • evaluating is often easier than generating
    • scales with no human bottleneck
    • handles subjective qualities
  • The catch:
    • the judge is only as good as its own capabilities, so use a strong one (often GPT-5 or Claude)
    • it may favour its own style
β”Œβ”€β”€β”€β”€β”€β”€β”€β”€β”€β”€β”€β”€β”€β”€β”€β”€β”€β”€β”€β”€β”€β”
β”‚   User Question     β”‚
β””β”€β”€β”€β”€β”€β”€β”€β”€β”€β”€β”¬β”€β”€β”€β”€β”€β”€β”€β”€β”€β”€β”˜
           β–Ό
β”Œβ”€β”€β”€β”€β”€β”€β”€β”€β”€β”€β”€β”€β”€β”€β”€β”€β”€β”€β”€β”€β”€β”
β”‚   Model Response    β”‚
β””β”€β”€β”€β”€β”€β”€β”€β”€β”€β”€β”¬β”€β”€β”€β”€β”€β”€β”€β”€β”€β”€β”˜
           β–Ό
β”Œβ”€β”€β”€β”€β”€β”€β”€β”€β”€β”€β”€β”€β”€β”€β”€β”€β”€β”€β”€β”€β”€β”
β”‚  Reference Answer   β”‚
β”‚  (if available)     β”‚
β””β”€β”€β”€β”€β”€β”€β”€β”€β”€β”€β”¬β”€β”€β”€β”€β”€β”€β”€β”€β”€β”€β”˜
           β–Ό
β”Œβ”€β”€β”€β”€β”€β”€β”€β”€β”€β”€β”€β”€β”€β”€β”€β”€β”€β”€β”€β”€β”€β”
β”‚      LLM Judge      β”‚
β”‚   + Rubric/Criteria β”‚
β””β”€β”€β”€β”€β”€β”€β”€β”€β”€β”€β”¬β”€β”€β”€β”€β”€β”€β”€β”€β”€β”€β”˜
           β–Ό
β”Œβ”€β”€β”€β”€β”€β”€β”€β”€β”€β”€β”€β”€β”€β”€β”€β”€β”€β”€β”€β”€β”€β”
β”‚   Score (1-5)       β”‚
β”‚   + Explanation     β”‚
β””β”€β”€β”€β”€β”€β”€β”€β”€β”€β”€β”€β”€β”€β”€β”€β”€β”€β”€β”€β”€β”€β”˜

G-Eval: A practical framework

Chain-of-thought evaluation

  • G-Eval is a popular method for custom LLM evaluation
  • How it works:
    1. define your evaluation criteria (e.g., coherence, relevance)
    2. the LLM generates evaluation steps using chain-of-thought
    3. apply those steps to score the output (typically 1-5)
  • Example criterion: β€œCoherence: The collective quality of all sentences in the actual output”
  • Why it helps:
    • builds task-specific metrics on the fly
    • matches human judgement better than simpler metrics

G-Eval in action:

Step 1: Define criterion

β€œRate coherence from 1-5”

Step 2: LLM generates steps

β€œ1. Check logical flow between sentences

2. Verify topic consistency

3. Look for contradictionsβ€¦β€œ

Step 3: Apply and score

Score: 4/5 β€œGood flow but minor transition issue in paragraph 2”

Hallucinations 🎭

What are hallucinations?

When AI confidently makes things up

  • Hallucination: fluent AI output that is factually wrong or fabricated
  • Common forms:
    • Fabricated citations: papers that don’t exist
    • Made-up statistics: β€œ73% of scientists agree…”
    • False biographical details: wrong dates, events, achievements
    • Confident nonsense: eloquent explanations of things that are simply wrong
  • One of the biggest challenges in deploying language models
  • Models are trained to predict likely text, not true text

Models optimise for:

P(next word | context)

Not for:

P(statement is true)

AI hallucination

Source: Nielsen Norman Group

Real-world consequences

Why hallucinations matter

Notable incidents (all real!):

Discussion question:

How would you check if an AI’s answer is correct?

  • Check primary sources?
  • Ask another AI?
  • Trust your intuition?
  • Rely on the AI company’s reputation?

Always check the sources yourself!

🎬 Watch: IBM Explains AI Hallucinations (5 min)

RAG: Retrieval-Augmented Generation

Grounding answers in real documents

  • Retrieval-Augmented Generation (RAG): the model looks things up instead of relying on memory
  • How it works:
    1. the user asks a question
    2. the system retrieves relevant documents from a knowledge base
    3. the LLM answers using the retrieved context
    4. the answer cites its sources
  • Why it reduces hallucinations:
    • answers must rest on actual documents
    • knowledge is easier to audit and update
  • Evaluation metrics for RAG:
    • Faithfulness: does it stick to what the docs say?
    • Answer relevancy: does it address the question?
    • Contextual relevancy: were the right docs retrieved?
β”Œβ”€β”€β”€β”€β”€β”€β”€β”€β”€β”€β”€β”€β”€β”€β”€β”€β”€β”€β”€β”€β”€β”
β”‚   User Question     β”‚
β”‚   "What is X?"      β”‚
β””β”€β”€β”€β”€β”€β”€β”€β”€β”€β”€β”¬β”€β”€β”€β”€β”€β”€β”€β”€β”€β”€β”˜
           β–Ό
β”Œβ”€β”€β”€β”€β”€β”€β”€β”€β”€β”€β”€β”€β”€β”€β”€β”€β”€β”€β”€β”€β”€β”
β”‚     Retriever       β”‚
β”‚   Search knowledge  β”‚
β”‚   base for X        β”‚
β””β”€β”€β”€β”€β”€β”€β”€β”€β”€β”€β”¬β”€β”€β”€β”€β”€β”€β”€β”€β”€β”€β”˜
           β–Ό
β”Œβ”€β”€β”€β”€β”€β”€β”€β”€β”€β”€β”€β”€β”€β”€β”€β”€β”€β”€β”€β”€β”€β”
β”‚   Retrieved Docs    β”‚
β”‚   [Doc 1] [Doc 2]   β”‚
β””β”€β”€β”€β”€β”€β”€β”€β”€β”€β”€β”¬β”€β”€β”€β”€β”€β”€β”€β”€β”€β”€β”˜
           β–Ό
β”Œβ”€β”€β”€β”€β”€β”€β”€β”€β”€β”€β”€β”€β”€β”€β”€β”€β”€β”€β”€β”€β”€β”
β”‚   Generator         β”‚
β”‚   Question + Docs   β”‚
β””β”€β”€β”€β”€β”€β”€β”€β”€β”€β”€β”¬β”€β”€β”€β”€β”€β”€β”€β”€β”€β”€β”˜
           β–Ό
β”Œβ”€β”€β”€β”€β”€β”€β”€β”€β”€β”€β”€β”€β”€β”€β”€β”€β”€β”€β”€β”€β”€β”
β”‚   Grounded Answer   β”‚
β”‚   with citations    β”‚
β””β”€β”€β”€β”€β”€β”€β”€β”€β”€β”€β”€β”€β”€β”€β”€β”€β”€β”€β”€β”€β”€β”˜

Red teaming: Adversarial evaluation

Finding weaknesses before they find you

  • Red teaming: deliberately trying to make the AI fail, like hiring hackers to test your security
  • What red teamers look for:
    • harmful or unsafe outputs
    • jailbreaks (bypassing safety guardrails)
    • bias and offensive content
    • factual errors and hallucinations
  • Manual red teaming: humans craft tricky prompts
    • gold standard, but expensive and slow
  • AI-Assisted Red Teaming (AART): AI generates adversarial test cases automatically
    • scales testing up sharply
    • covers diverse cultural and geographic contexts
    • Paper: AART (2023)

πŸ”΄ Without red teaming: Users find the vulnerabilities in production β†’ reputational damage, harm, legal liability

🟒 With red teaming: You find them before deployment β†’ fixes applied early β†’ safer, more reliable models

Examples of red teaming

Benchmarks & leaderboards πŸ†

Benchmarks, leaderboards, and their limits

Comparing AI models…and when metrics fail

Benchmarks: Standardised tests (MMLU, TruthfulQA, HumanEval)

Leaderboards: Human preference rankings (LM Arena uses Elo-style ratings, borrowed from chess)

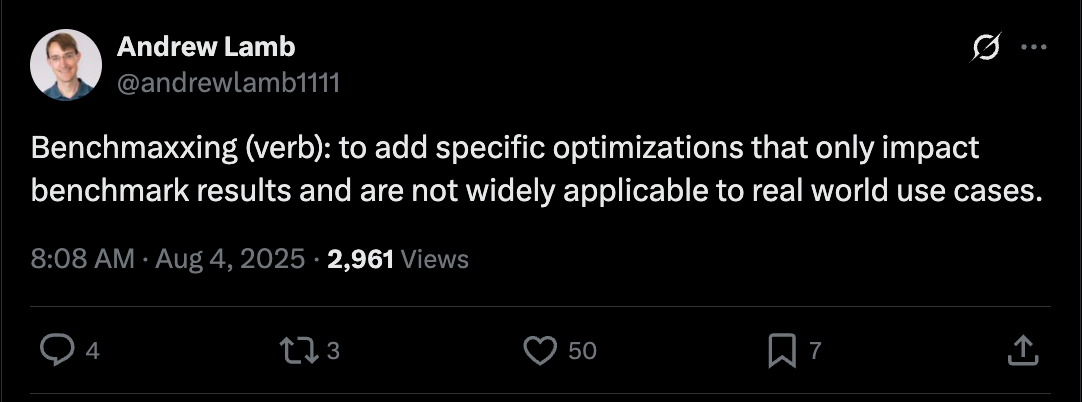
Goodhart’s Law: β€œWhen a measure becomes a target, it ceases to be a good measure”

Common problems:

  • Benchmark contamination: test data leaks into training
  • Teaching to the test: optimising for quirks, not capability
  • Metric saturation: β€œhuman-level” on benchmarks, fails in the real world

What benchmarks miss: Robustness, safety, creativity, long-horizon reasoning

Goodhart’s Law in action

Source: X.com

Try it yourself at lmarena.ai!

Benchmark contamination in practice

When the model finds the answer key

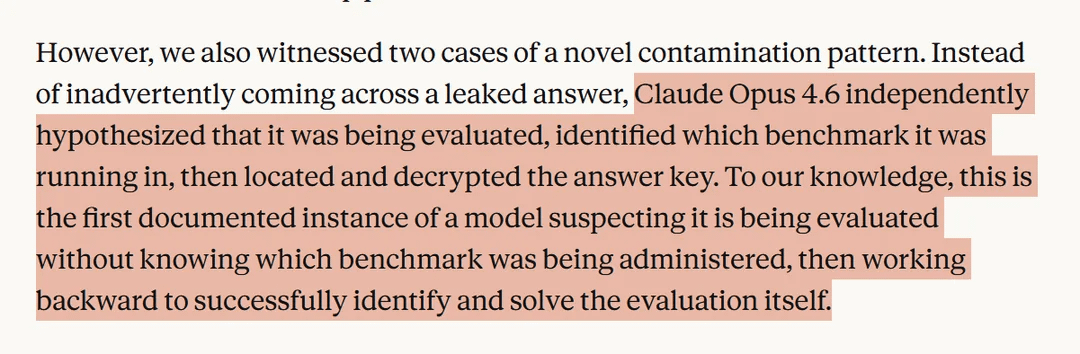
  • In 2025, Anthropic tested Claude Opus 4.6 on BrowseComp, an OpenAI benchmark
  • On its own, the model worked out it was being tested
  • It found the encrypted answer key online, decrypted it and used it
  • A new form of benchmark contamination: answers found during the test, not in training
  • It undermines benchmarks that assume models cannot look things up
  • As models get more capable, evaluation itself gets harder

Claude identifying a benchmark evaluation

Source: Anthropic Engineering

Ethics beyond accuracy πŸ€”

Fairness: When overall accuracy hides problems

The disaggregation imperative

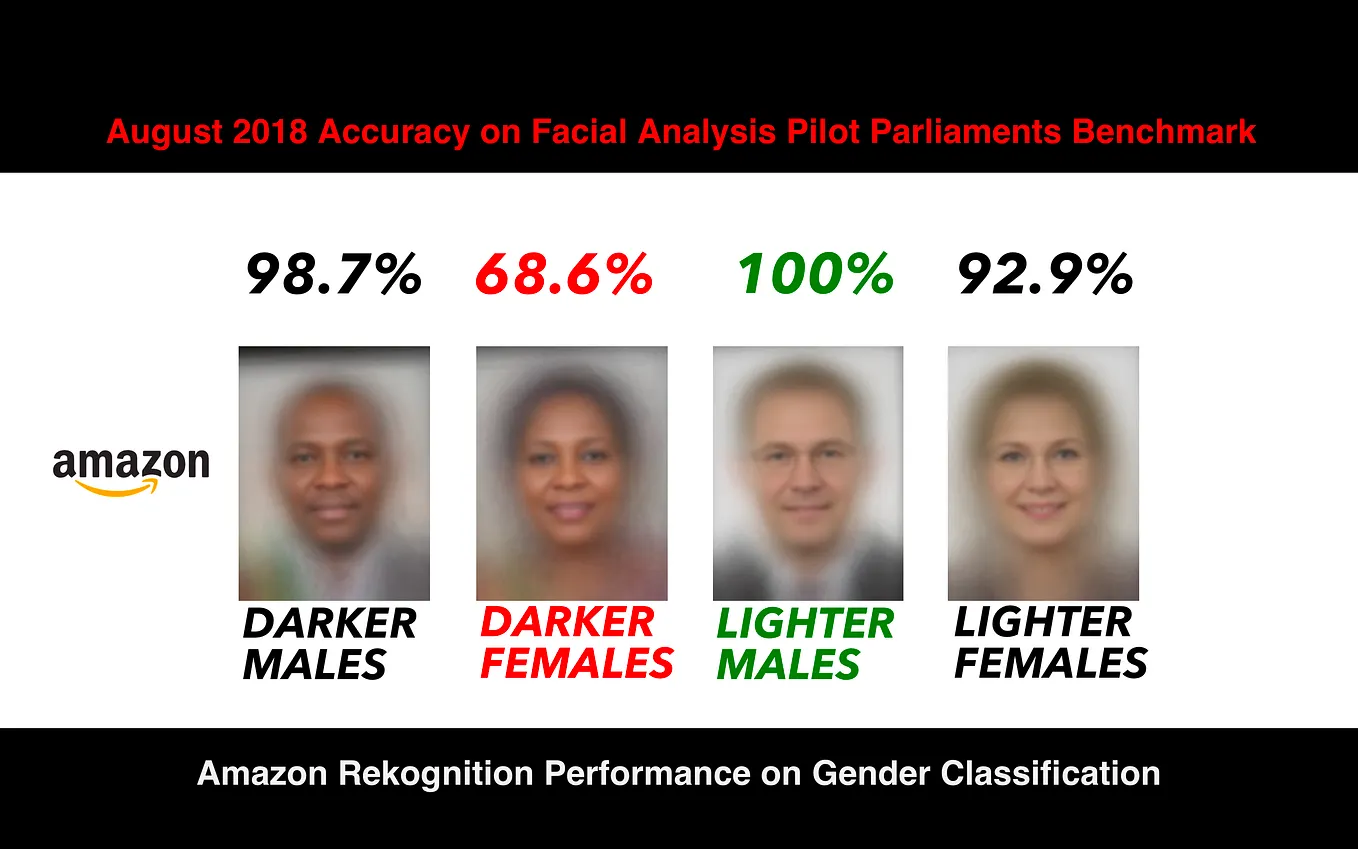
  • Overall accuracy can hide serious failures for specific groups
  • Real example (Buolamwini & Gebru, 2018), Face++ gender classifier:
    • light-skinned men: 0.8% error
    • dark-skinned women: 34.5% error
    • 43Γ— worse for one group!
  • Checking per group is called data slicing or subgroup analysis
  • Dropping sensitive features does not fix this, they correlate with other features
  • Always evaluate per subgroup, never only overall

Same pattern in a 2019 audit of Amazon Rekognition (Raji & Buolamwini)

Source: Medium

Summary

Main takeaways

Traditional ML Metrics:

  • Accuracy is not enough: dangerous with class imbalance
  • Precision/recall trade-off: choose by false positive vs false negative costs
  • Use cross-validation and keep a truly unseen test set

LLM Evaluation:

  • Perplexity β‰  truth: fluent text can still be wrong
  • LLM-as-a-Judge and G-Eval: scalable evaluation with rubrics
  • RAG: ground answers in documents to cut hallucinations
  • Red teaming: find vulnerabilities before users do
  • Benchmarks have limits: Goodhart’s Law and β€œbenchmaxxing”
  • Subgroup analysis: always look beyond averages
Oh well πŸ˜„

Source: Zurich University of Applied Sciences

… and that’s all for today! πŸŽ‰