



%%{init: {'theme': 'base', 'themeVariables': {'fontSize': '17px'}}}%%
flowchart TB
    A[📊 Data Selection] --> B[📝 Guideline Design]
    B --> C[👥 Annotator Training]
    C --> D[🧪 Pilot Labelling]
    D --> E{Quality OK?}
    E -->|No| B
    E -->|Yes| F[🏭 Full Labelling]
    F --> G[✅ QC Checks]
    G --> H[📈 Aggregation]
    H --> I[🎯 Final Dataset]
    style E fill:#f9f,stroke:#333,stroke-width:2px
    style I fill:#90EE90,stroke:#333,stroke-width:2px
Main takeaways
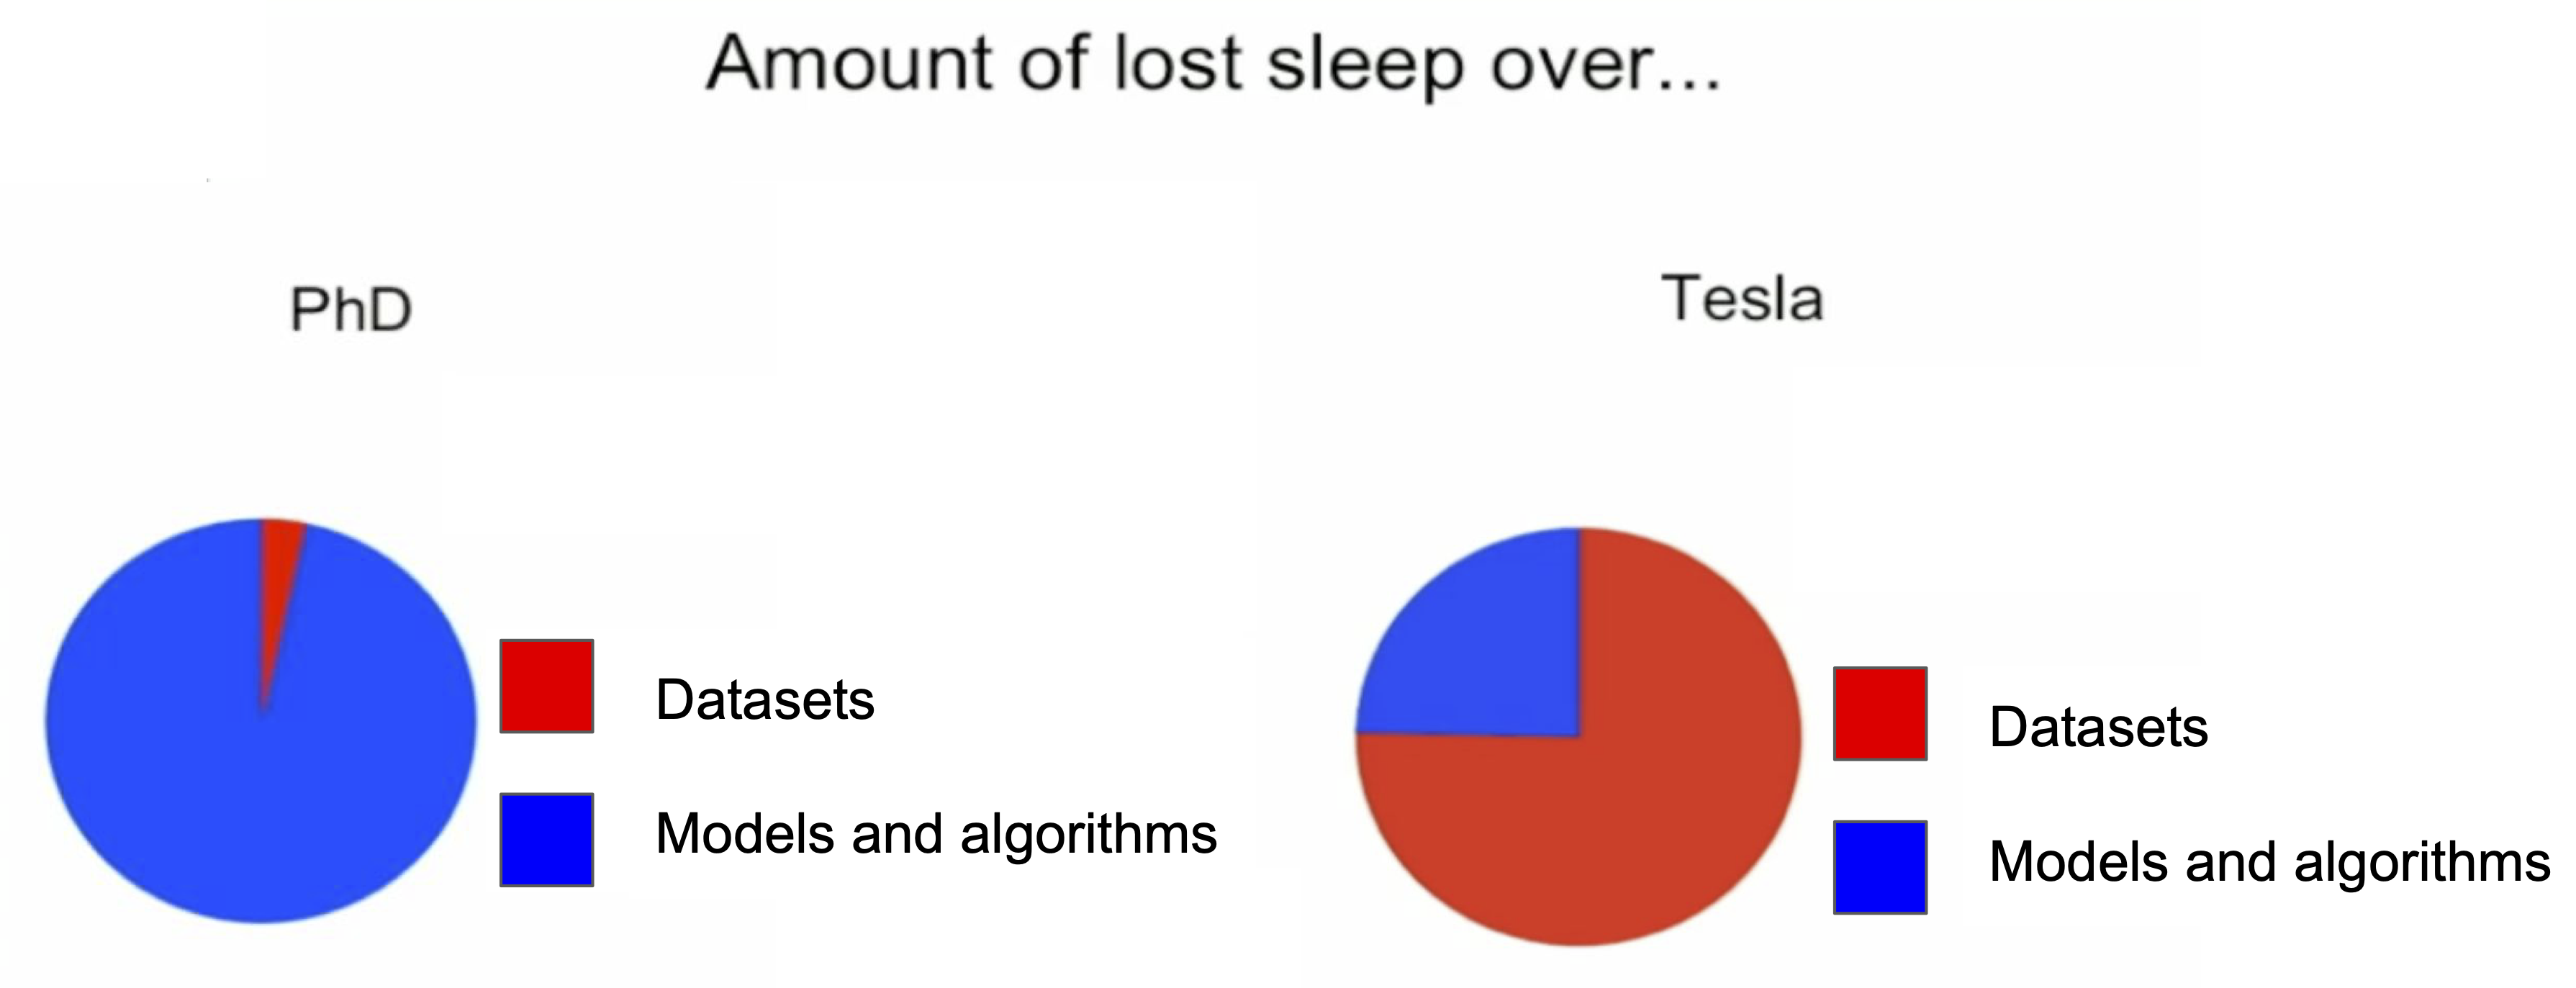
Data quality > algorithm sophistication for most real problems
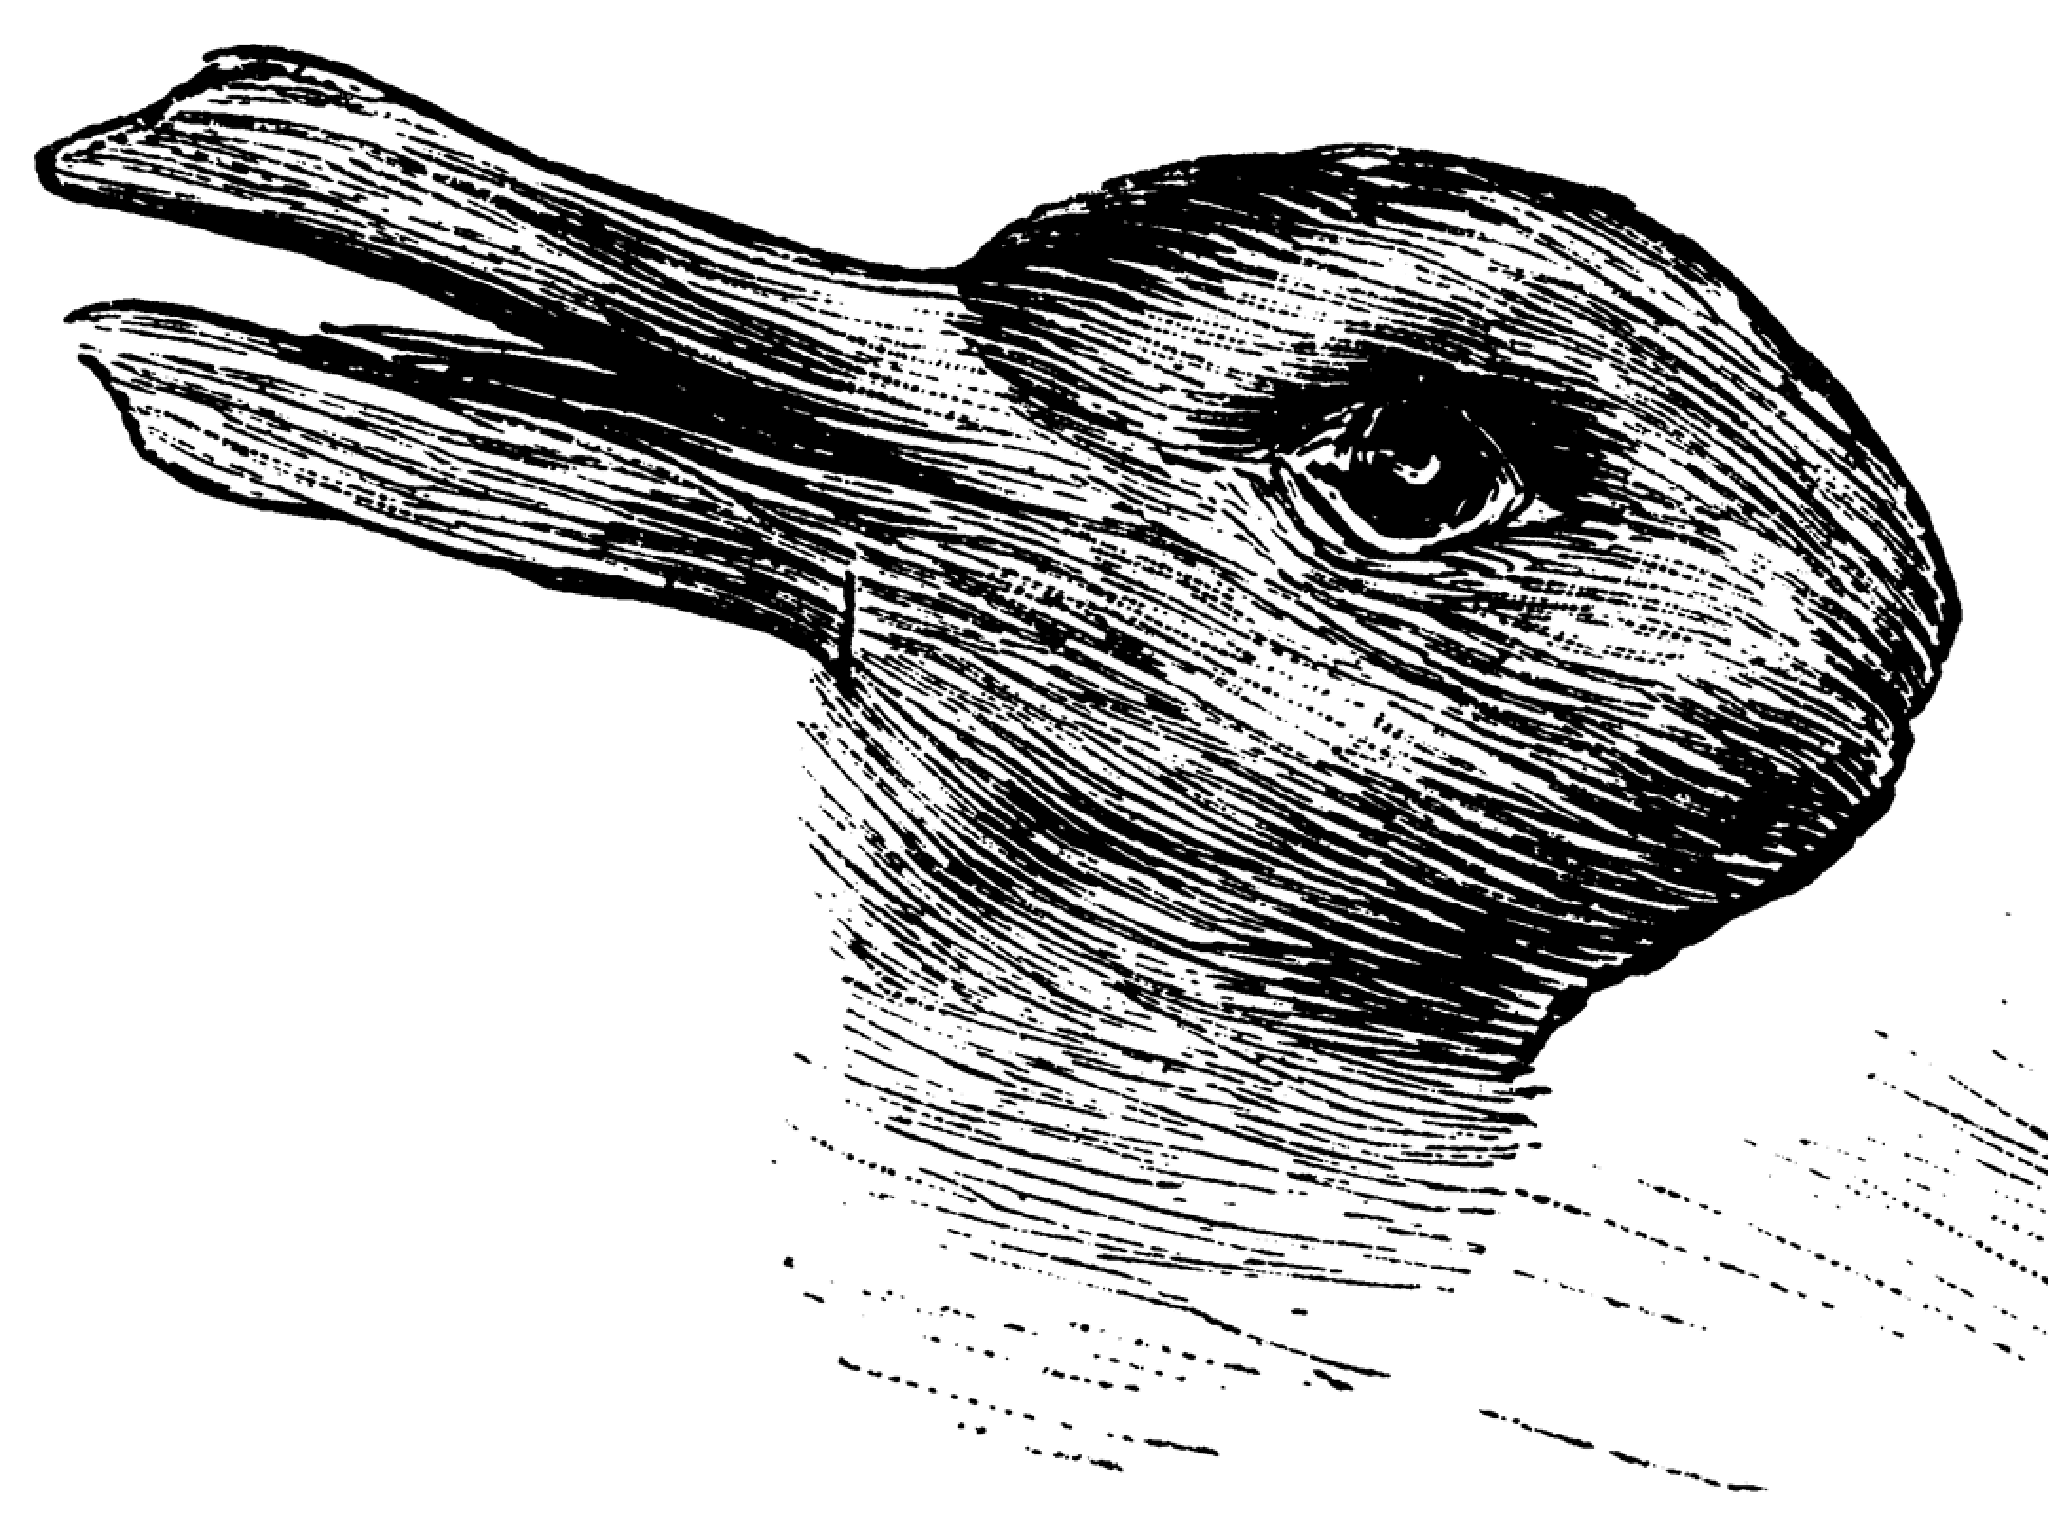
Problem framing sets what data you need and how to label it
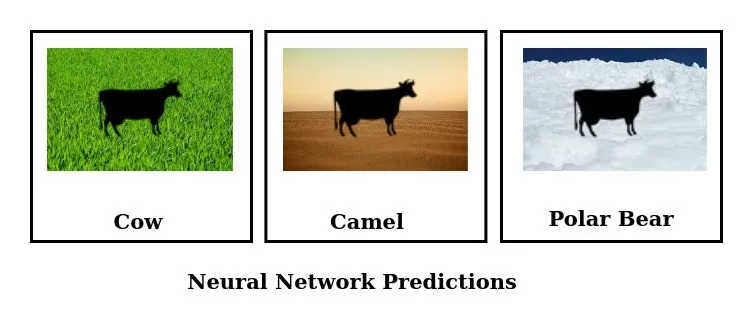
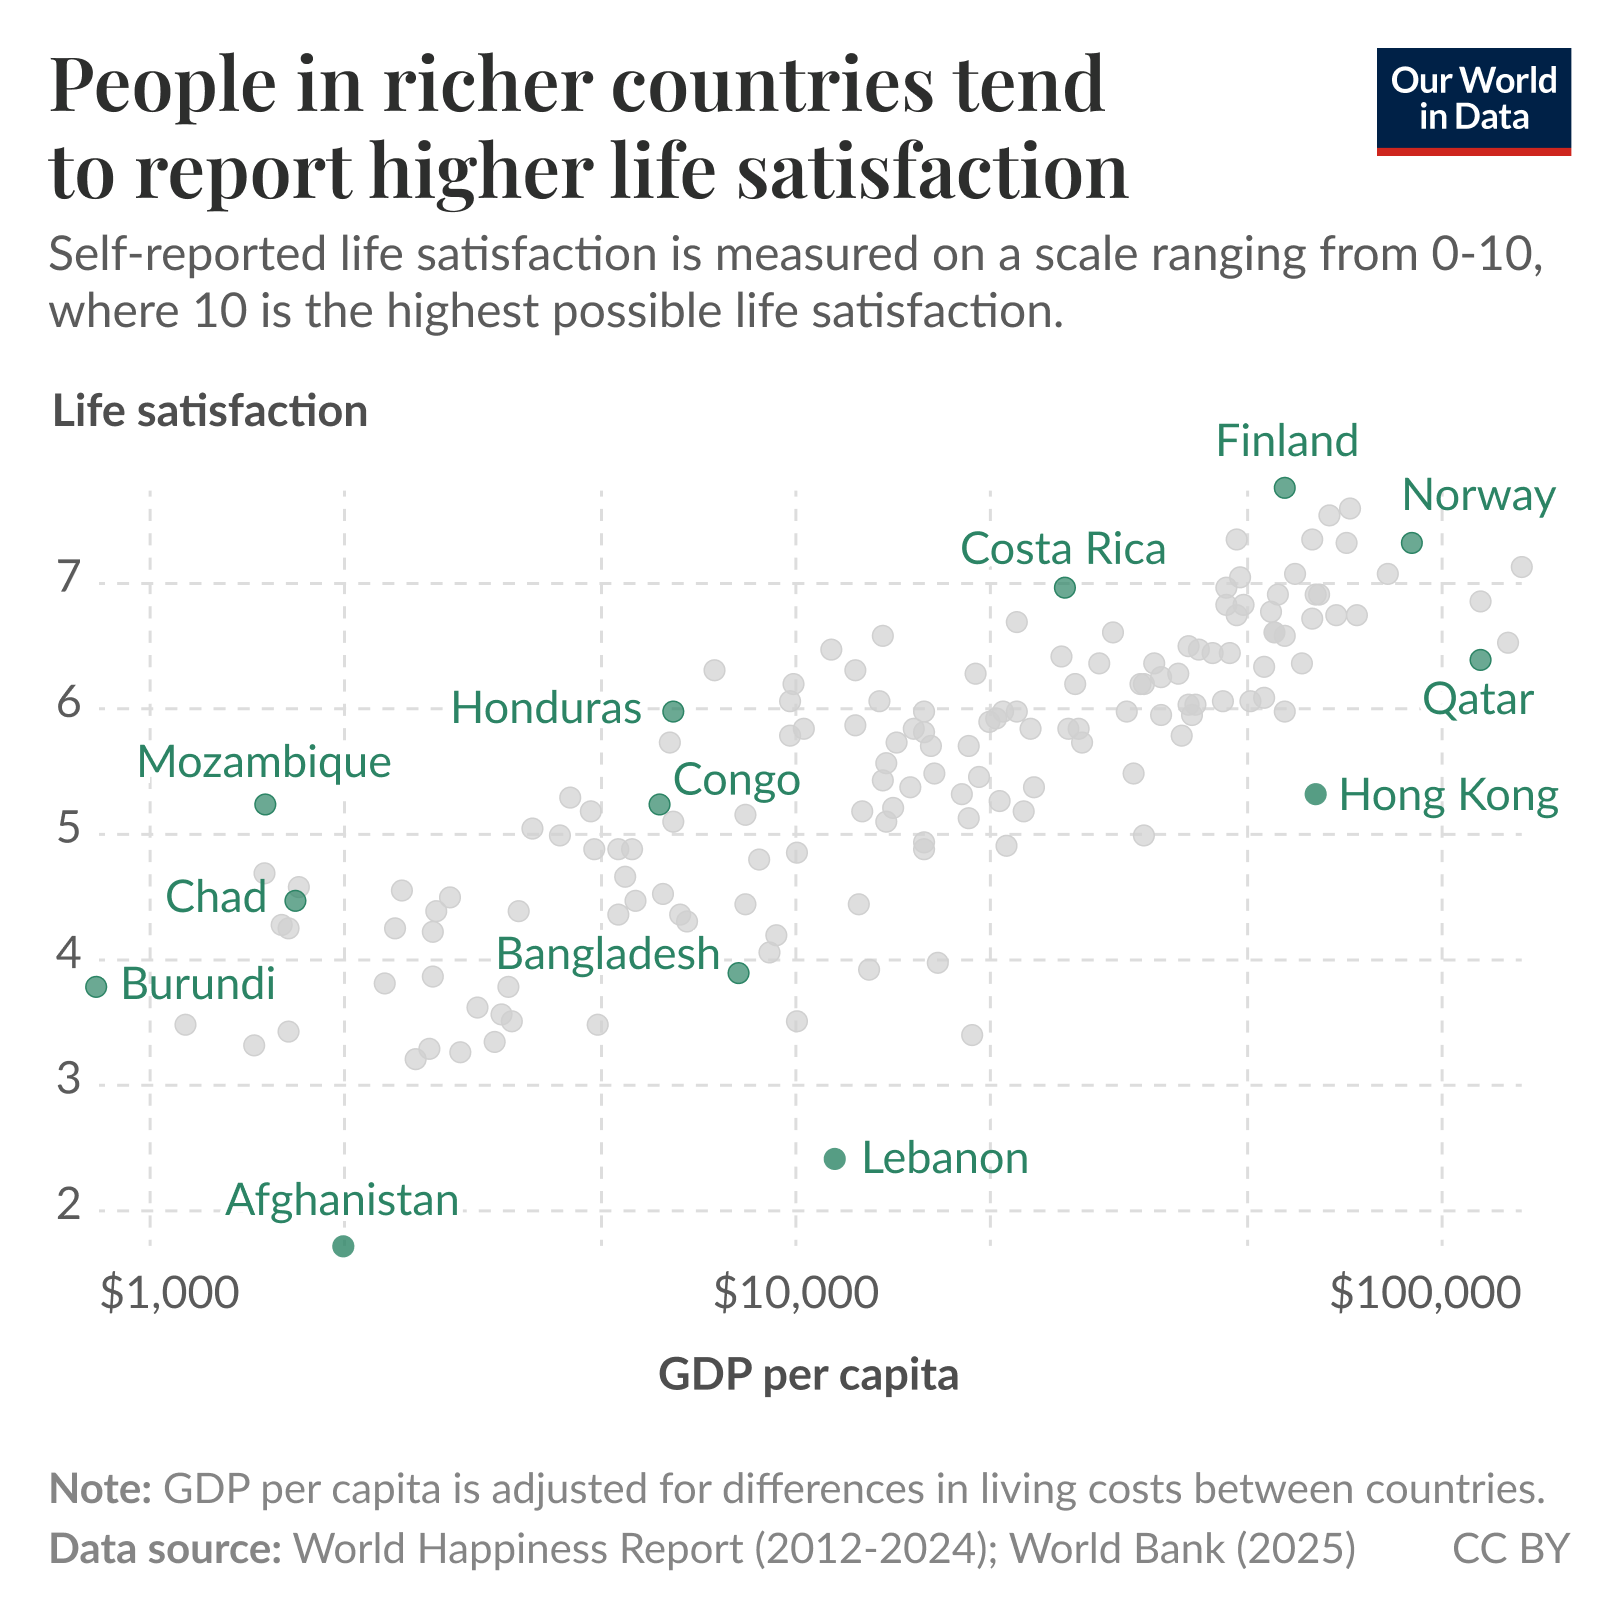
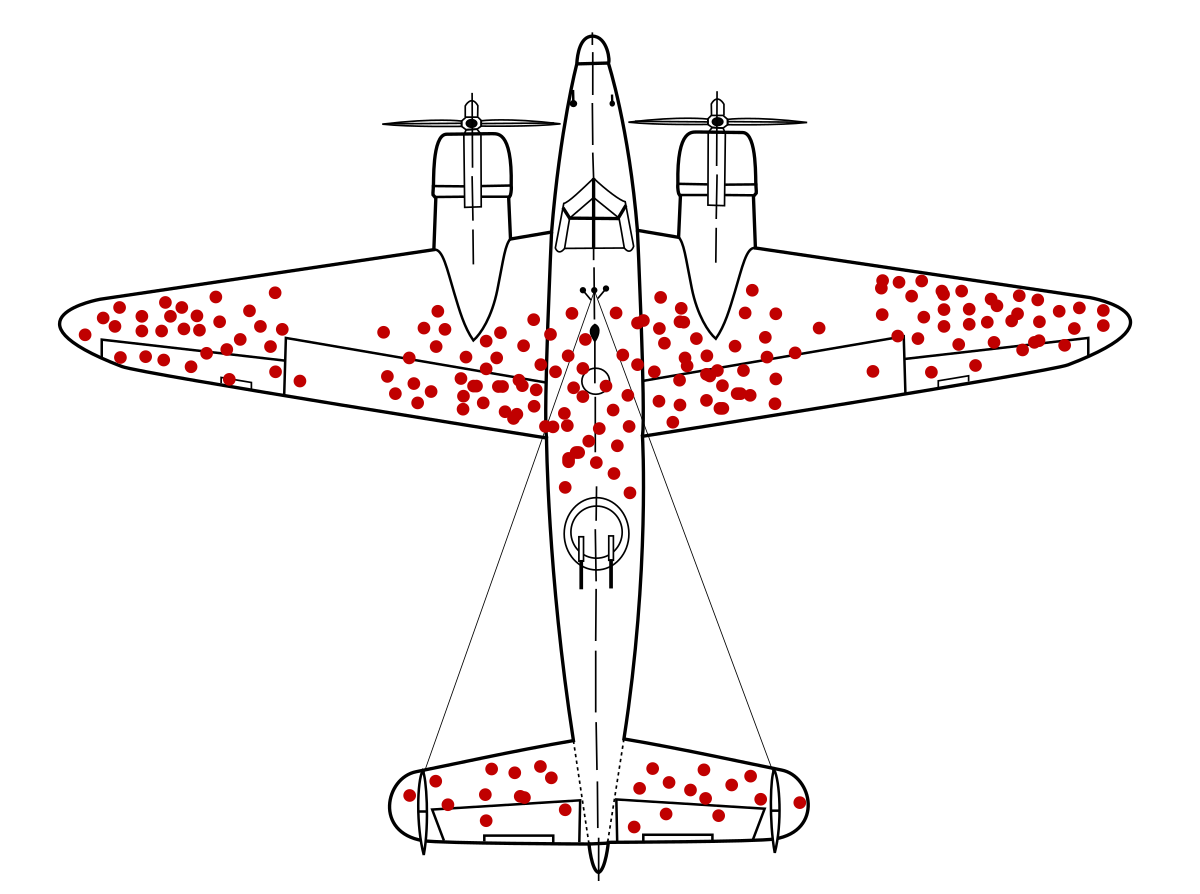
Selection bias is a major source of error. List the biases before you collect
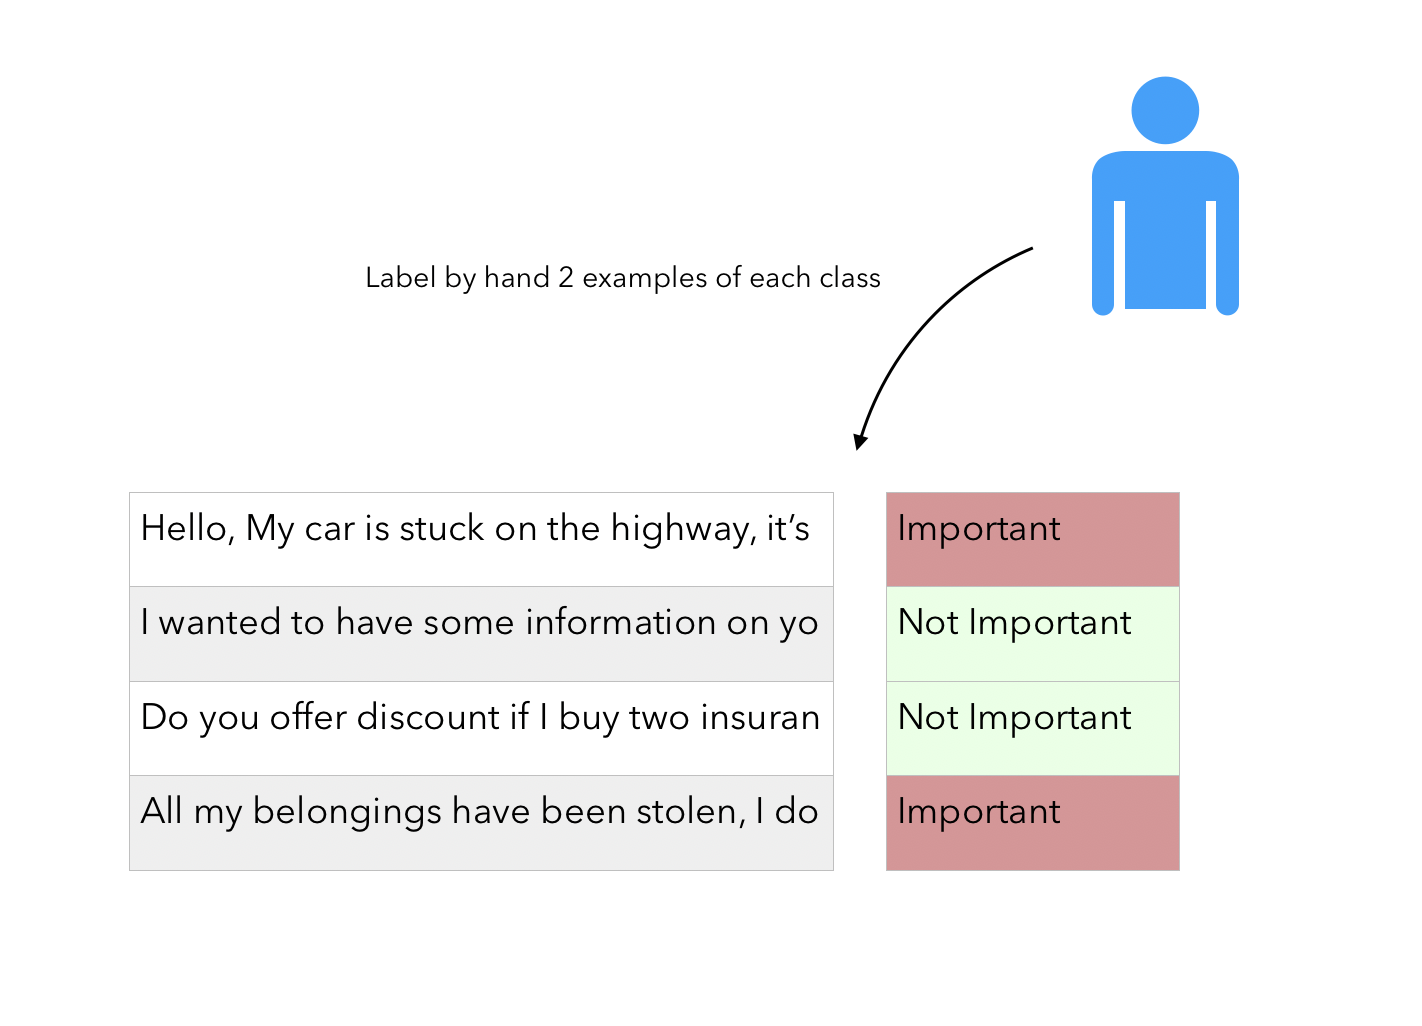
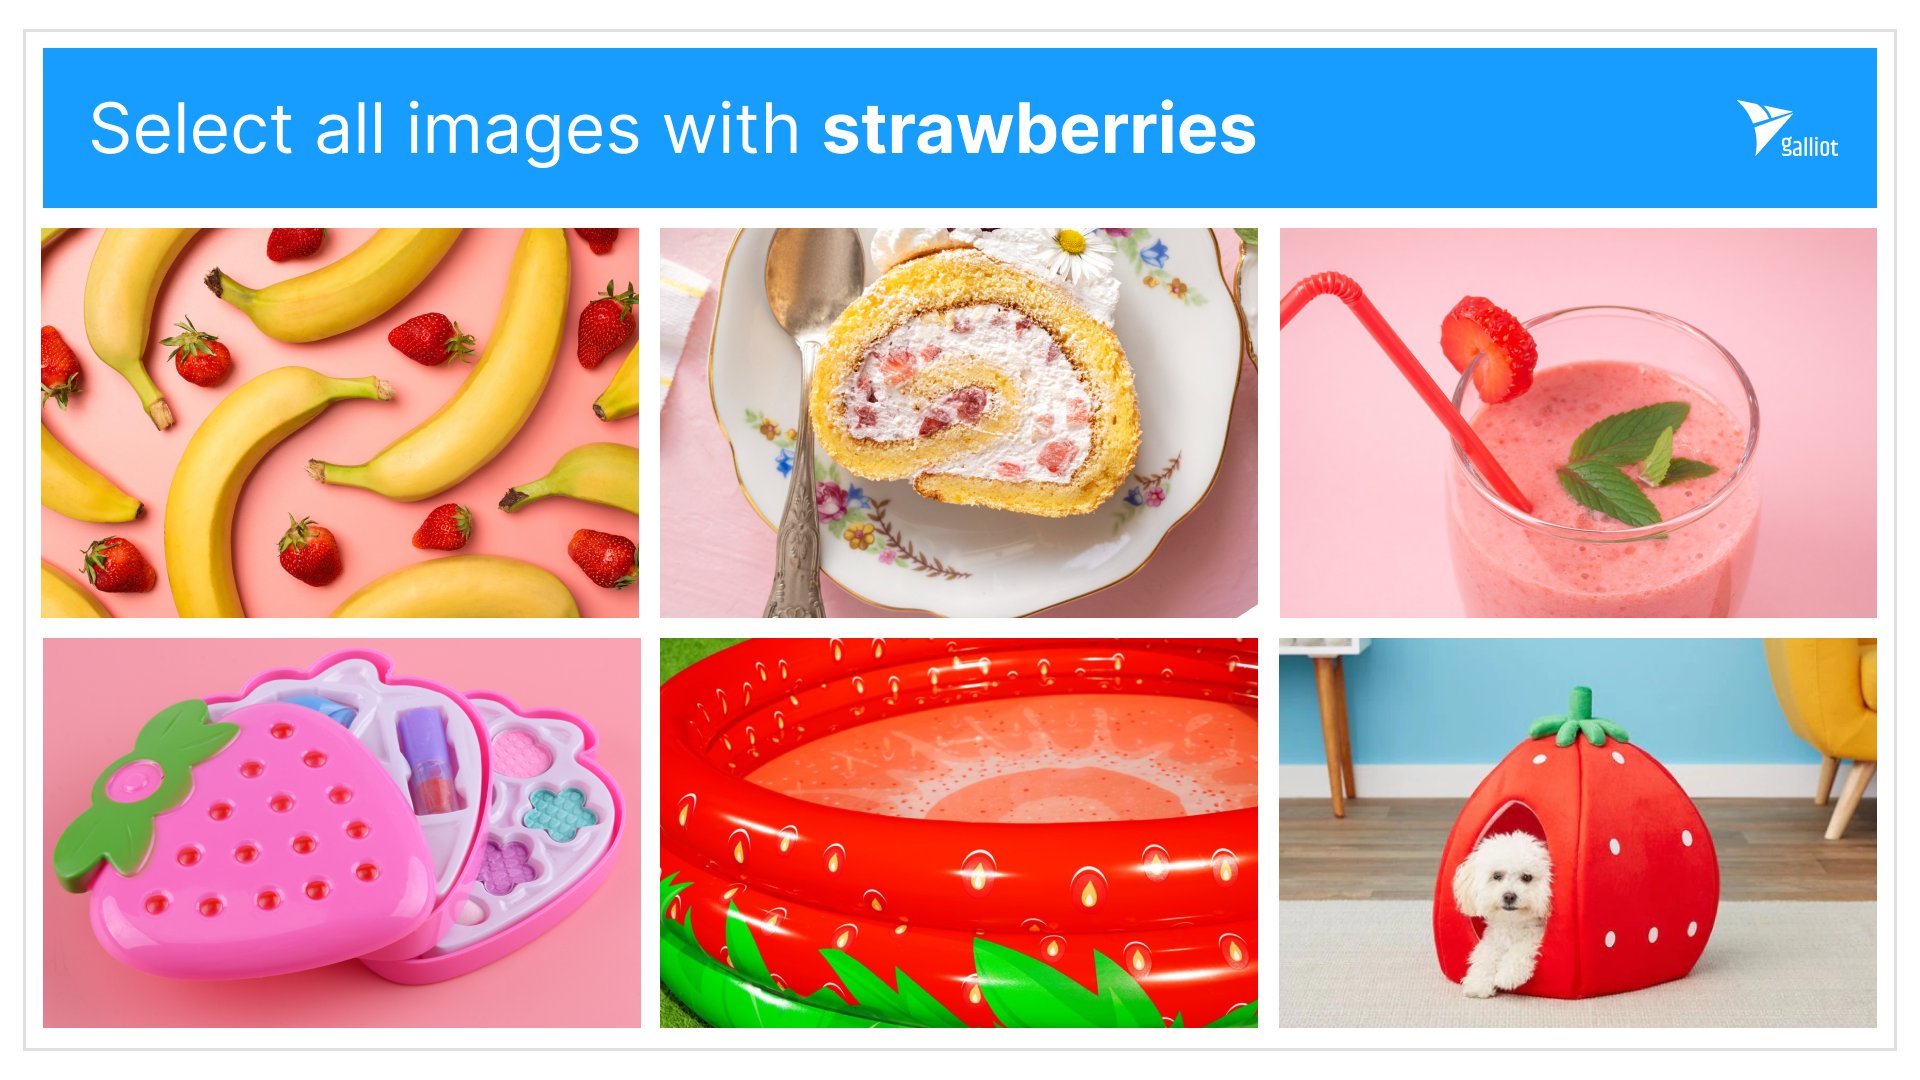
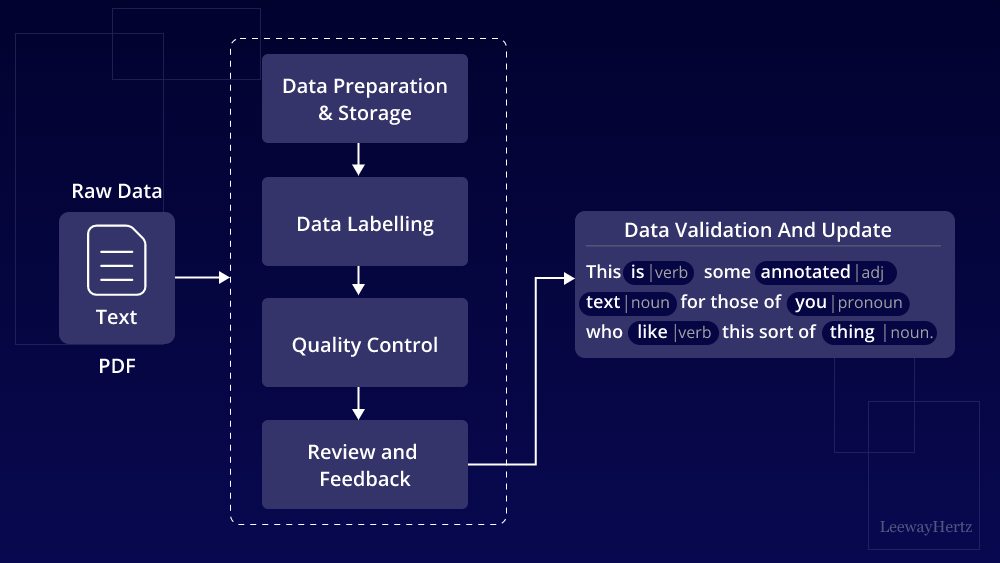
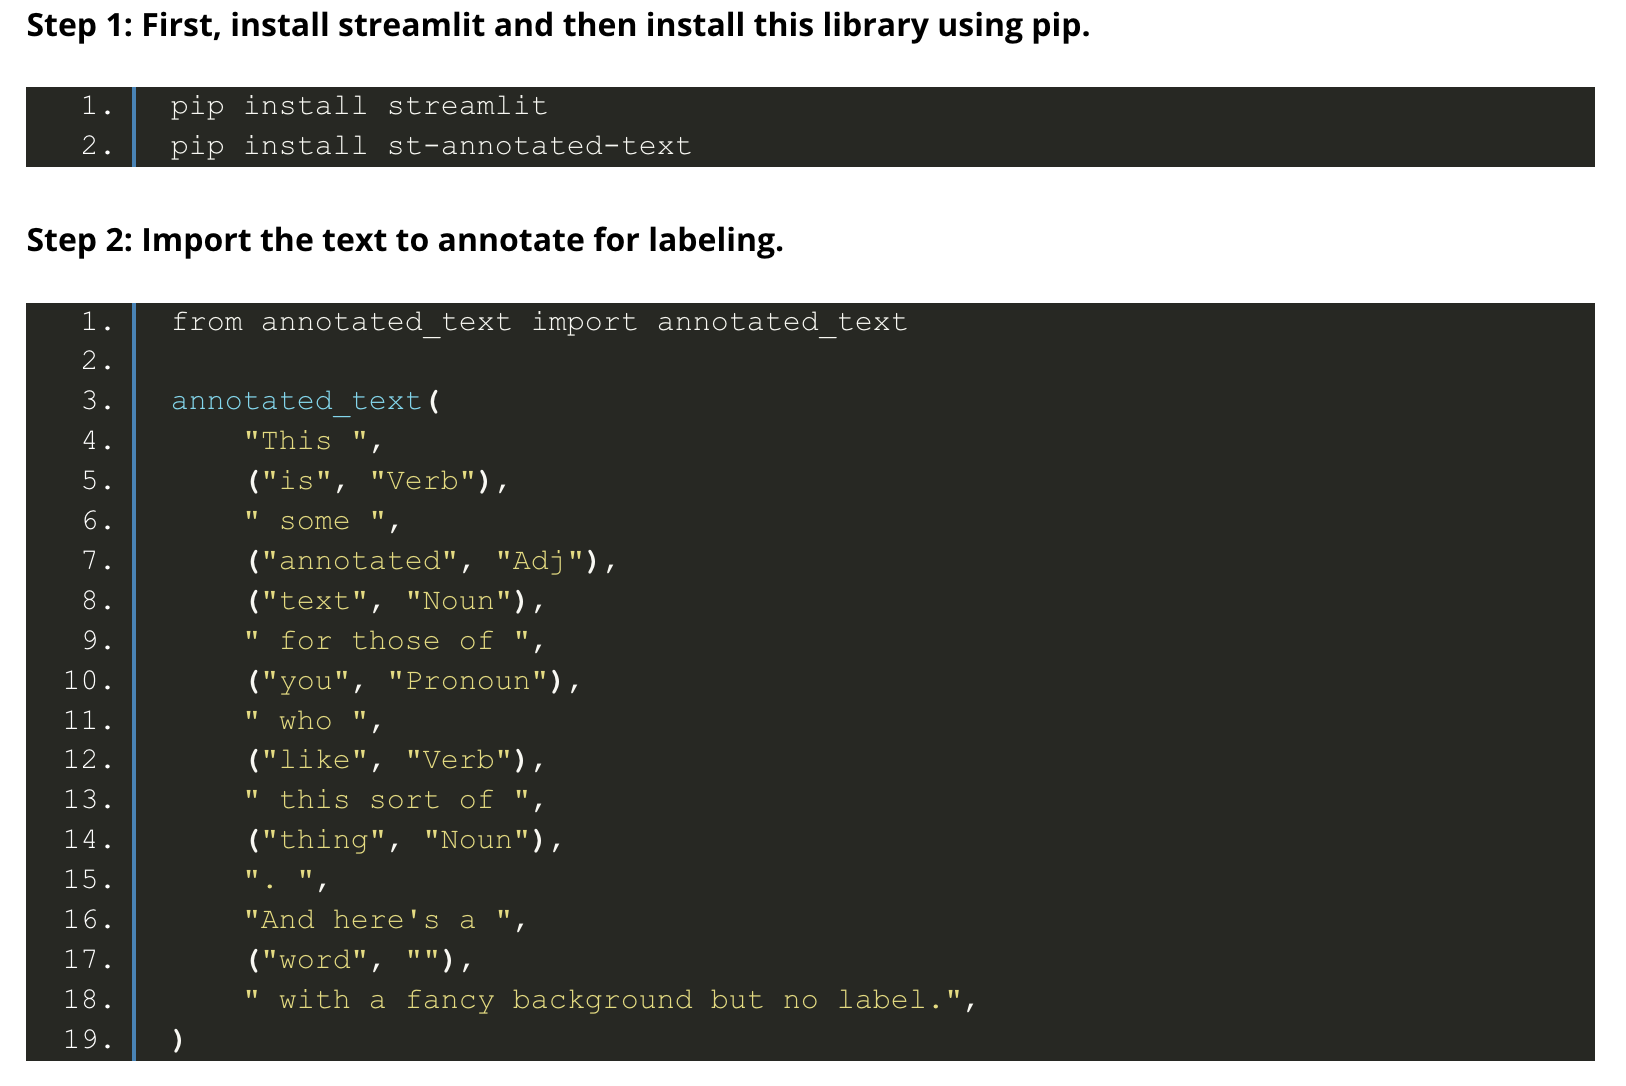
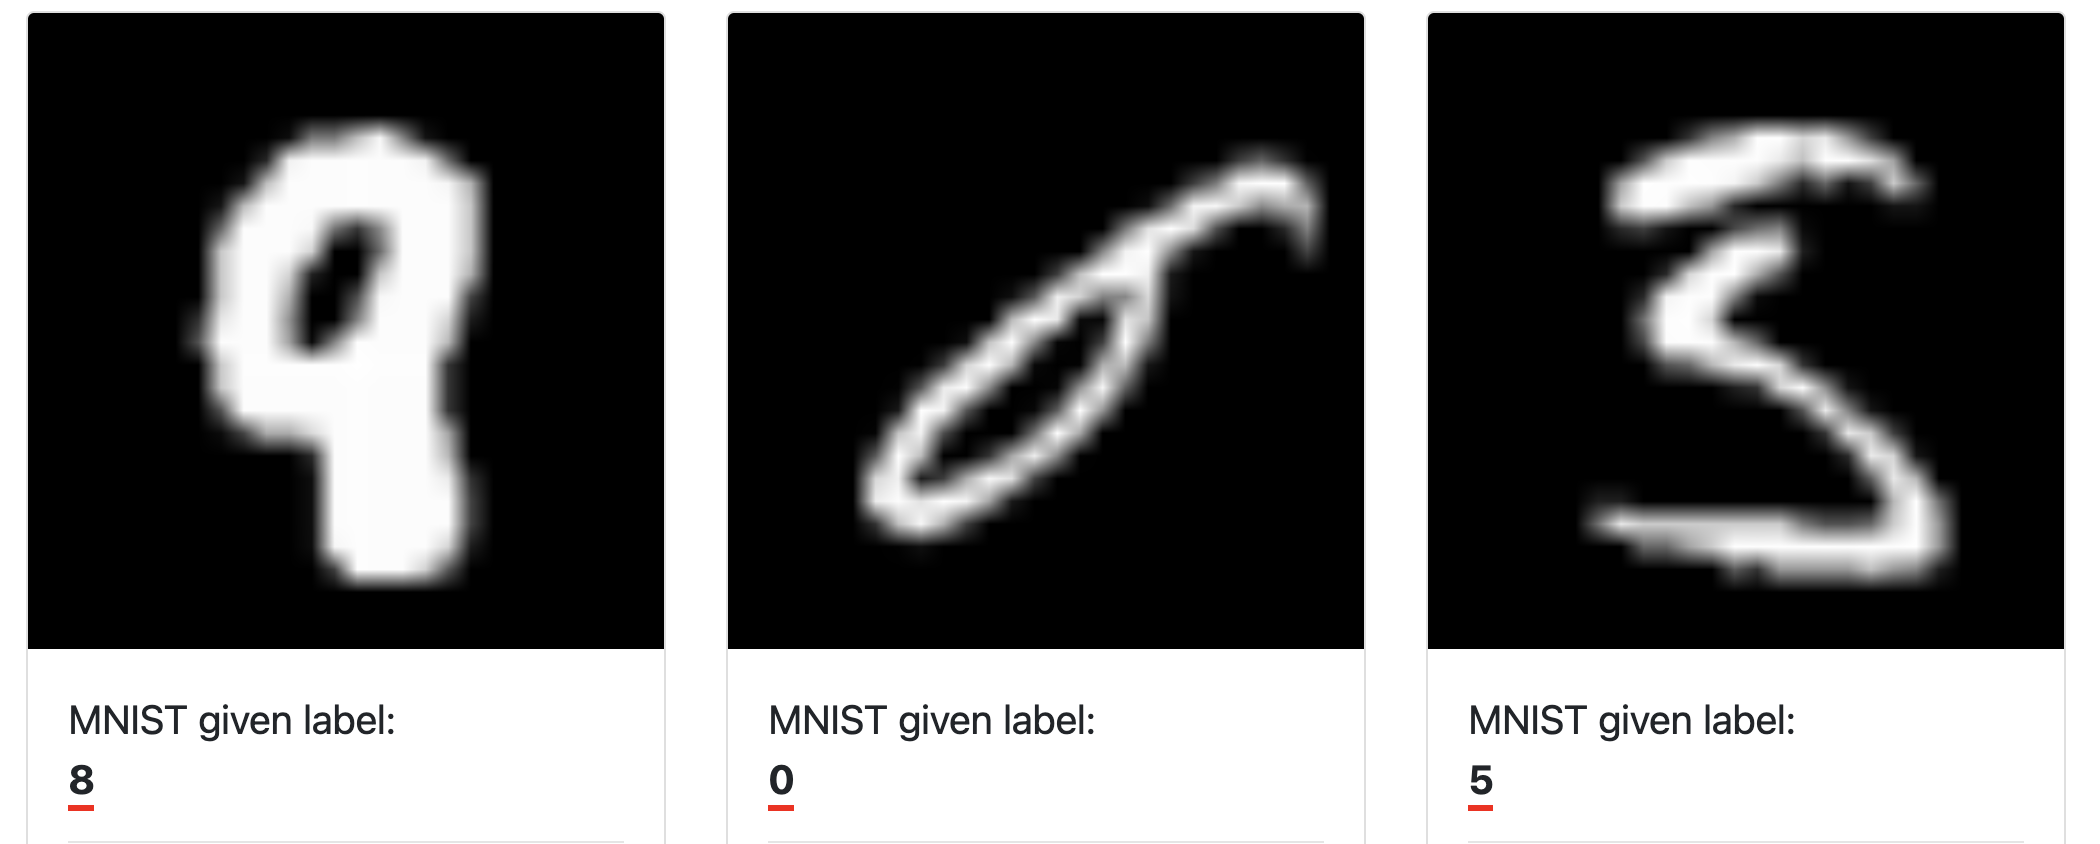
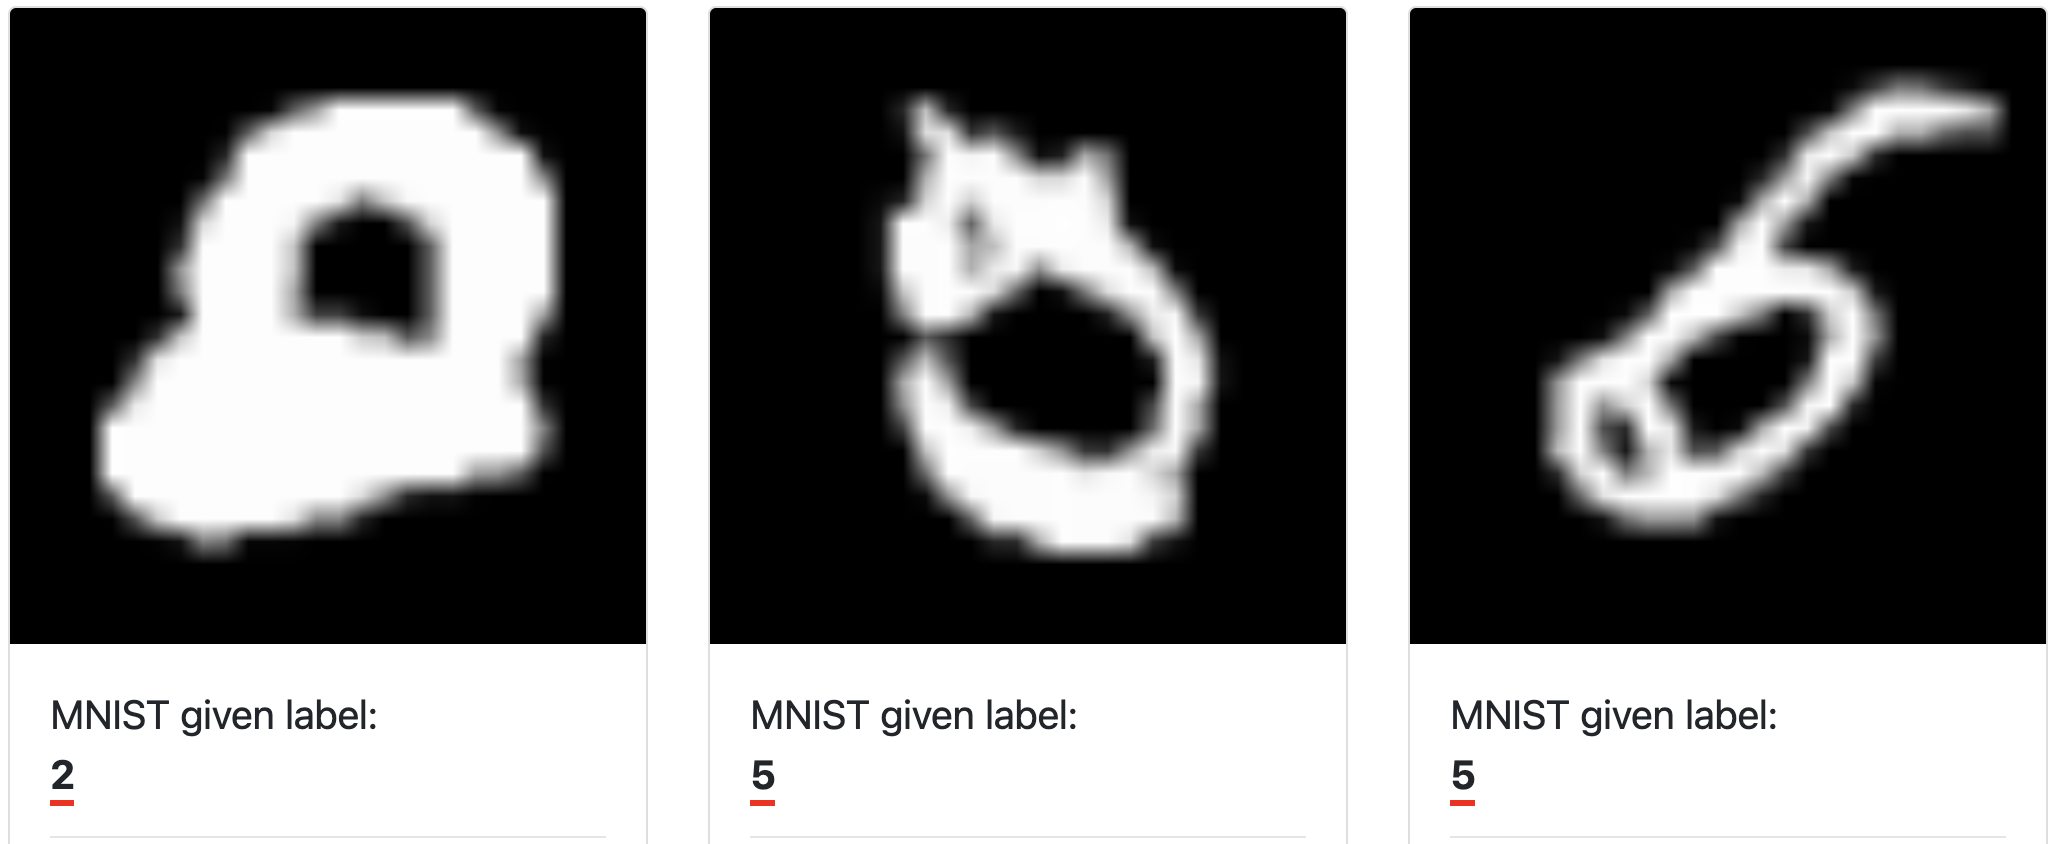
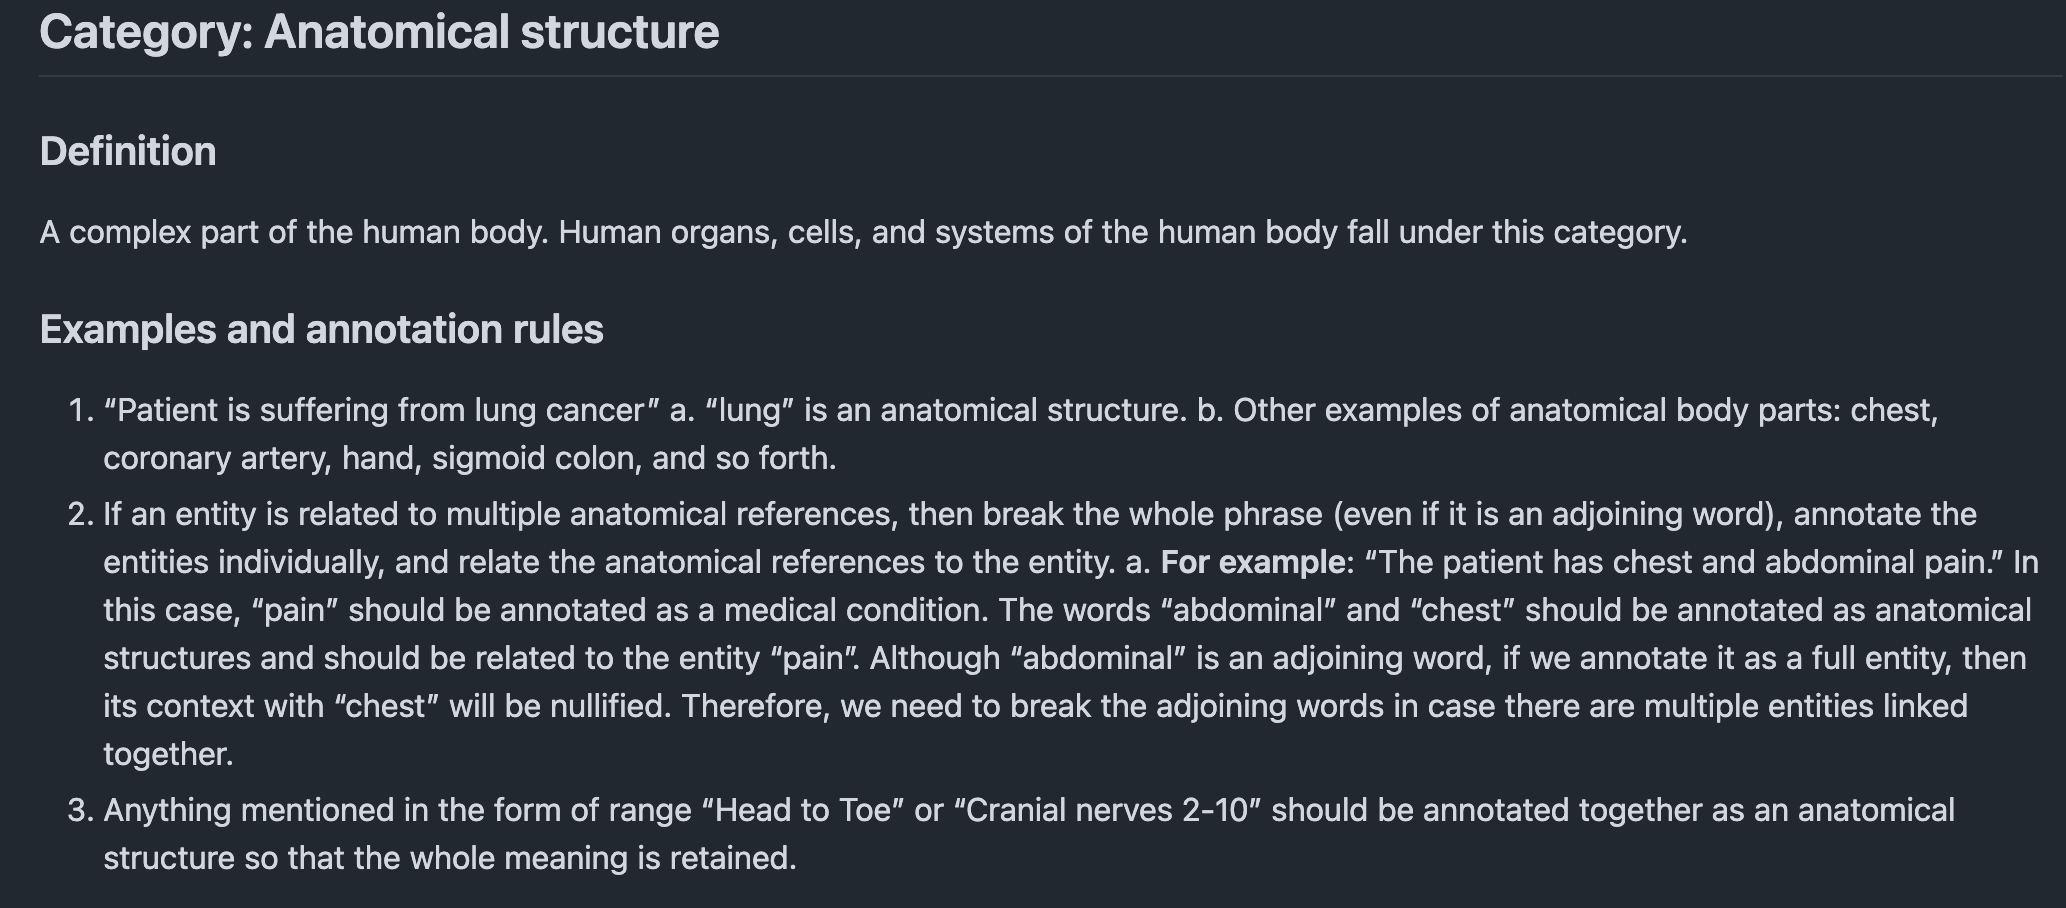
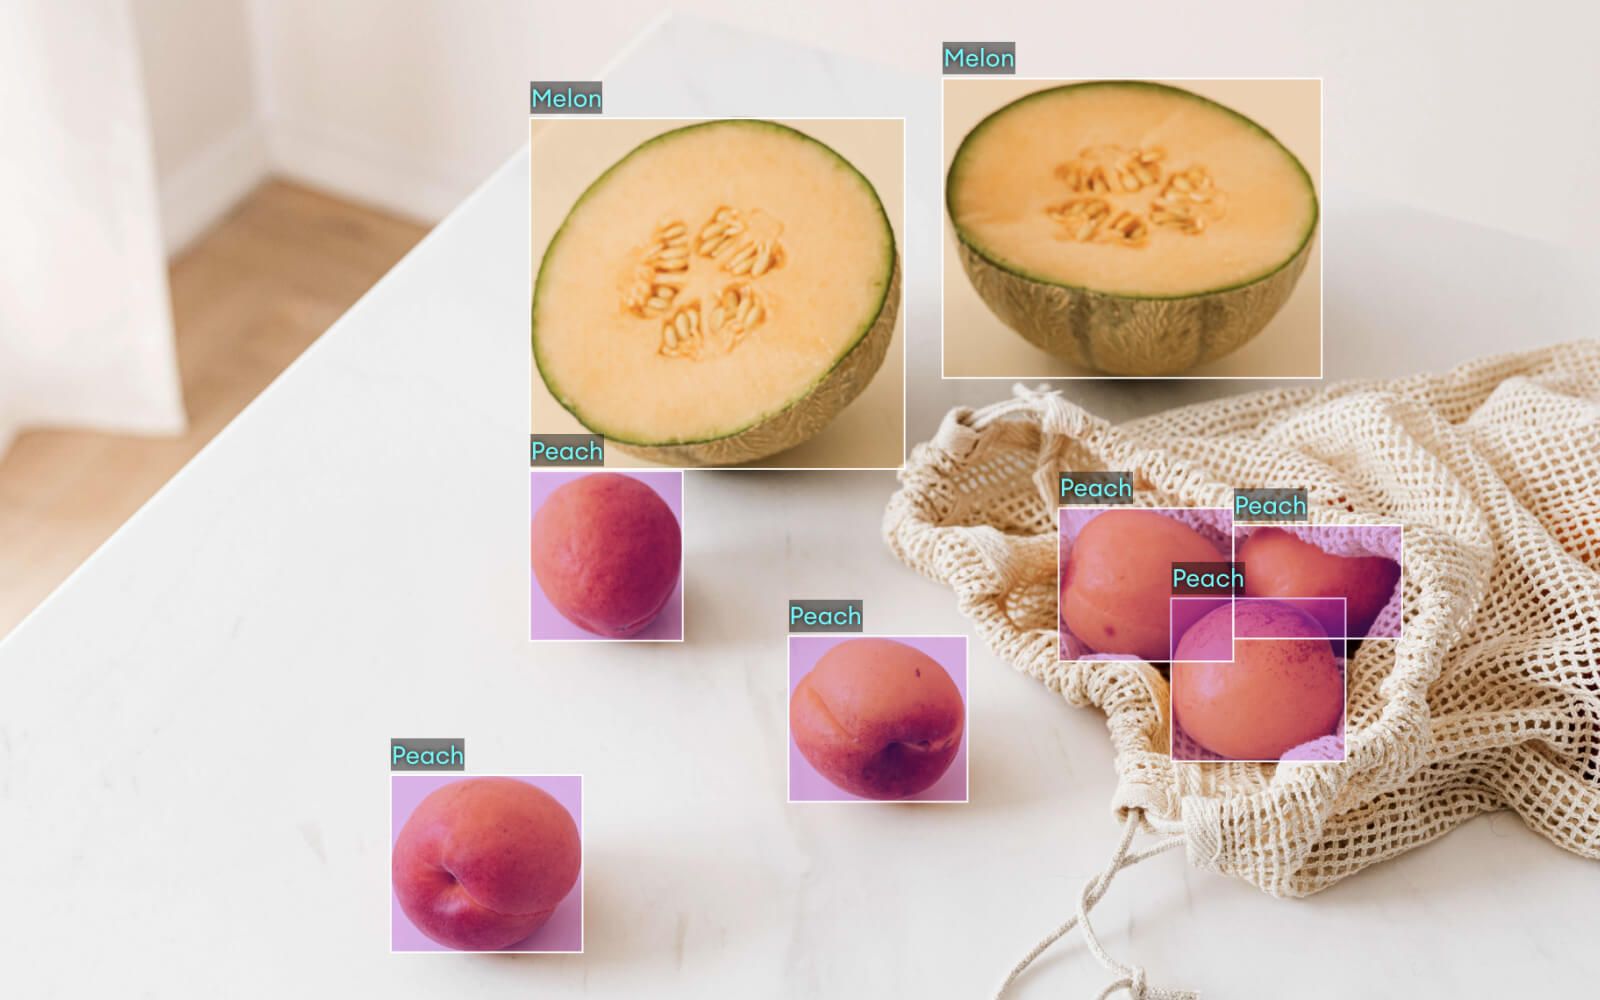
Labelling is hard, so write clear guidelines and check the work
Multiple annotators improve reliability, but aggregate intelligently
Document everything, and your future self will thank you