print("Welcome to QTM 151!")

x = 5
y = 10
z = x + y
print(z)Jupyter Notebook and Markdown Tutorial
Introduction
This tutorial will introduce you to Jupyter Notebook and Markdown. Jupyter Notebook is an interactive computing platform that allows users to create and share documents that contain live code, equations, visualisations, and narrative text. Markdown is a lightweight markup language that is used to format text, and can be used for everything - websites, documents, notes, books, presentations, email messages, and technical documentation. Even WhatsApp and Facebook Messenger use Markdown to format messages. So if you have already italicised a word or made a text bold on WhatsApp, you have used Markdown!
This tutorial is divided into two parts. The first part will introduce you to Jupyter Notebook and show you how to create a new notebook, run code cells, and format text cells using Markdown. The second part will provide a more in-depth look at Markdown and show you how to create headings, lists, links, images, and tables.
Introduction to Jupyter Notebook
What is Jupyter Notebook?
Jupyter Notebook is an open-source web application that allows you to create and share documents that contain live code, equations, visualizations, and narrative text. Jupyter Notebook supports over 40 programming languages, including Python, R, and Julia. Jupyter Notebook is widely used in data science, machine learning, scientific computing, and other fields.
Jupyter Notebooks provide an interactive development environment that allows you to write and execute code, see the results immediately, and create reproducible analyses. Jupyter Notebooks are organized into cells, which can contain code, text, equations, or visualisations. You can run individual cells or the entire notebook, and you can save your work as a notebook file (.ipynb) that can be shared with others.
Creating a New Notebook
First, please make sure you have Python, Jupyter Notebook, and VSCode installed on your computer. If you do not have these installed, please refer to the VSCode and Anaconda Tutorial for instructions on how to install them.
To create a new Jupyter Notebook in VSCode, please go to the tab “File” > “New File”. You will see a prompt in the middle of the screen. Select the option “Jupyter Notebook”.
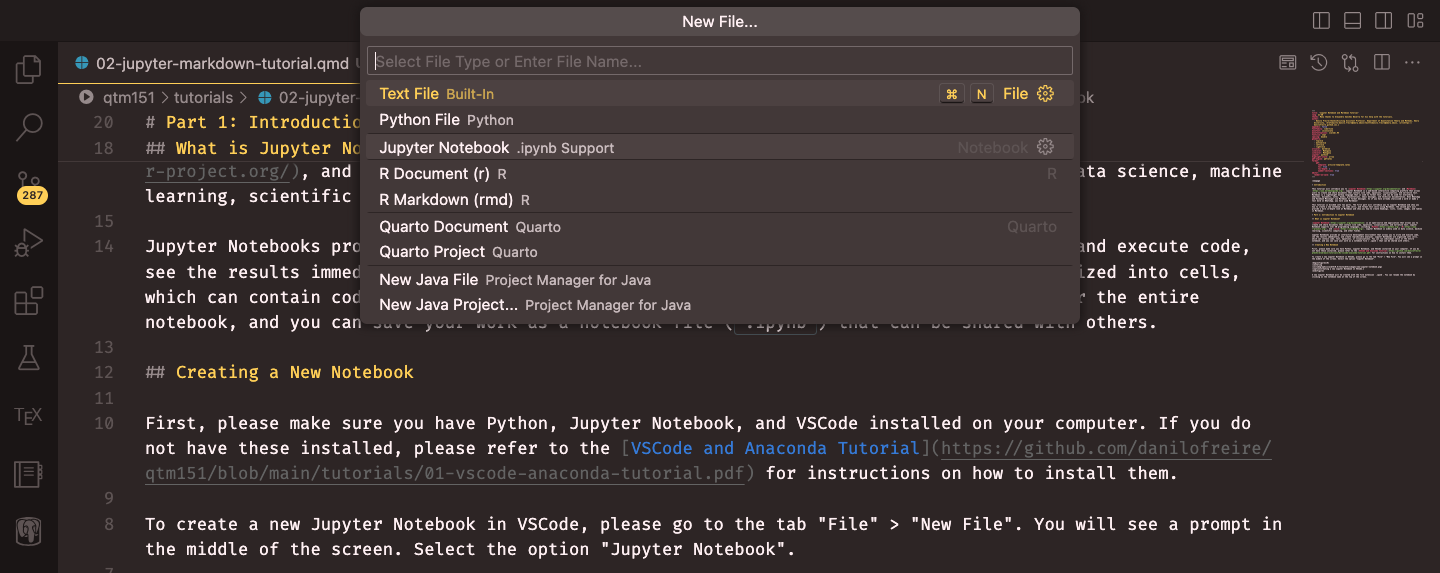
A new Jupyter Notebook will be created with the file extension .ipynb. You can rename the notebook by clicking on the notebook name at the top of the screen. An empty notebook will look like this:
![]()
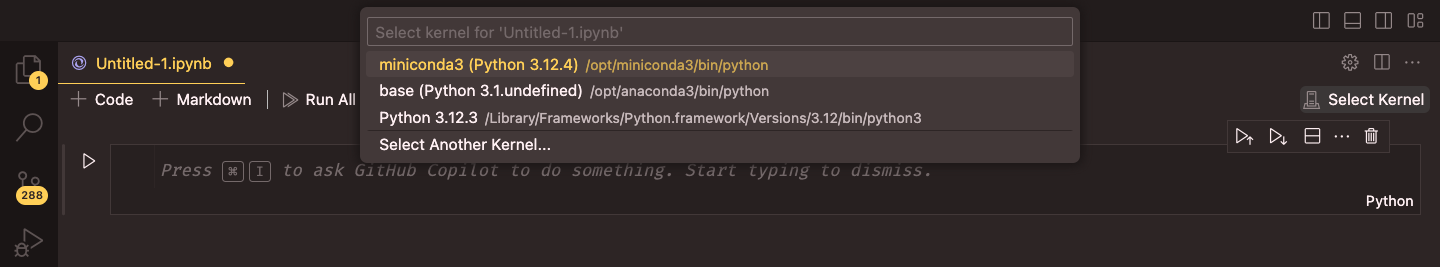
Please do not forget to select the Python interpreter that you want to use for the notebook. You can do this by clicking on the Python version at the top right corner of the screen. A prompt will appear, and you can select the Python interpreter that you want to use (in this case, Anacoda’s “base”).
To create a chunk of Python code click on “+ Code.” You will get an empty gray box which has Python on the lower-right corner. You can type Python code in this box and run it by clicking on the “Run” button on the left side of the box. You can also run the code by pressing “Shift + Enter” on your keyboard.
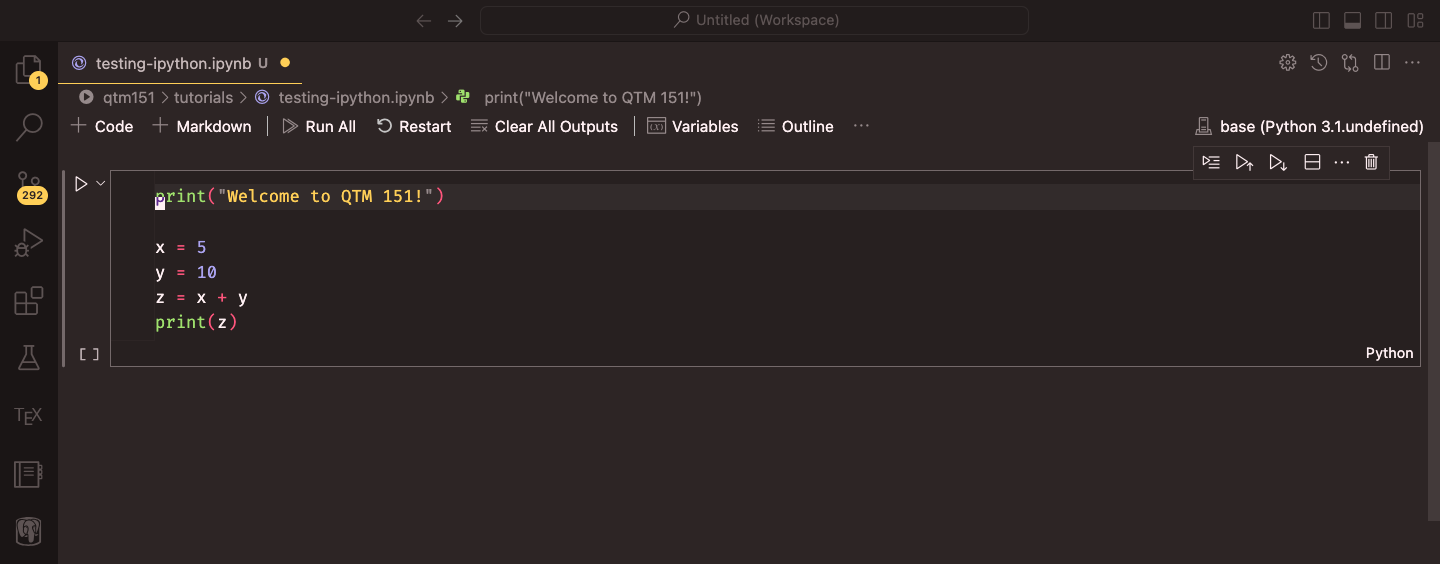
Here you should enter the Python commands. For example, type the following lines of code in the code cell:
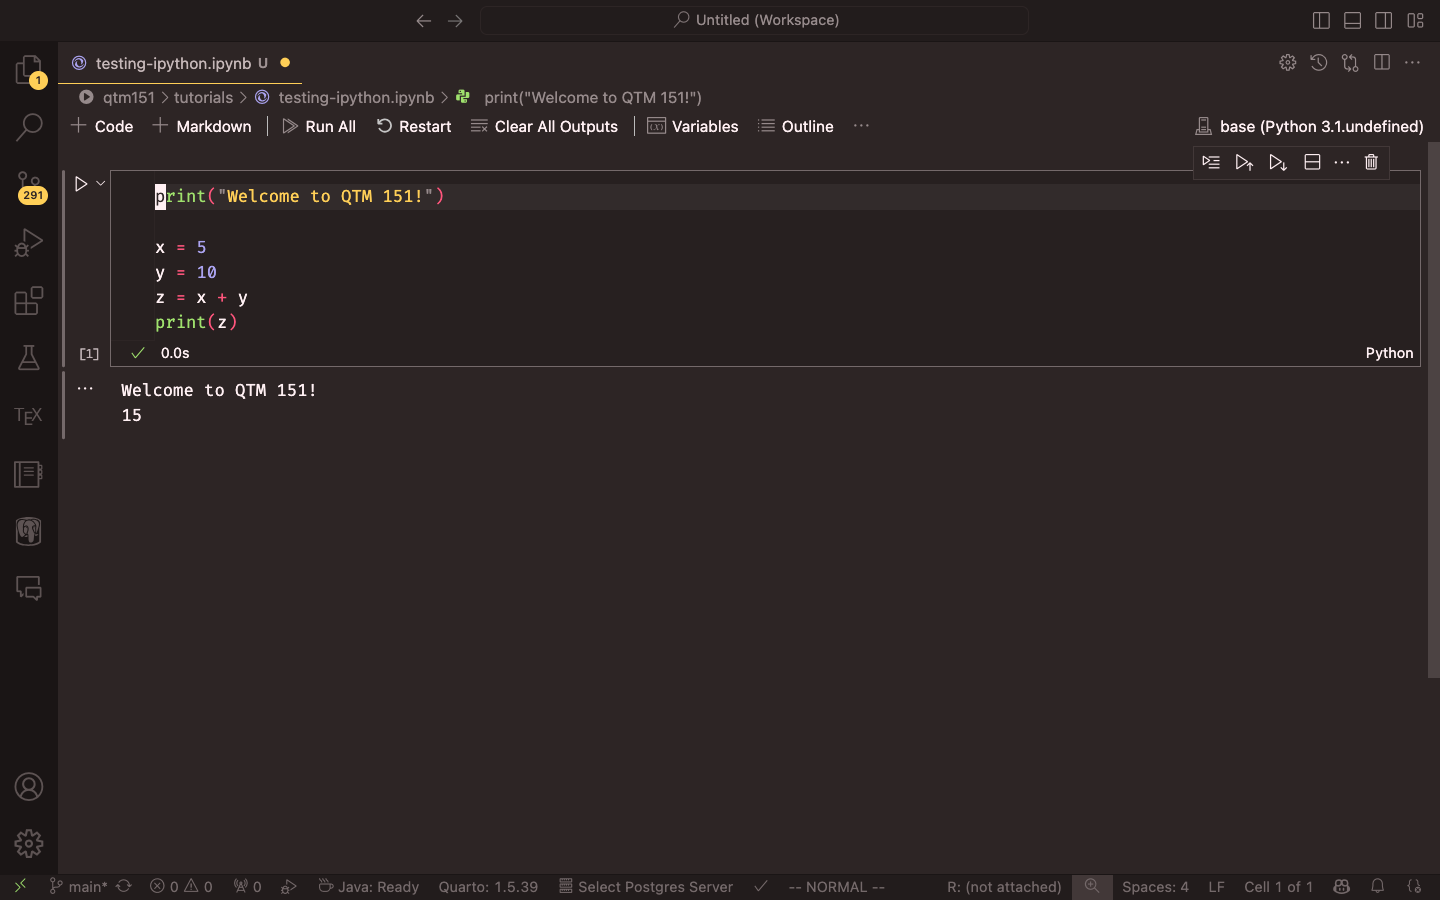
The results of the code will be displayed below the code cell. In this case, the output will be:
To create a text cell click on “+ Markdown.” You will get an empty white box where you can type text. We will cover Markdown in more detail in the next section. But for now, you can type the following text in the Markdown cell:
# Welcome to QTM 151!

This is a Jupyter Notebook. You can write *text*, **equations**, and `code`
in [this notebook](https://github.com/danilofreire/qtm151/blob/main/tutorials/testing-ipython.ipynb).
The text will be displayed in the text cell like this:
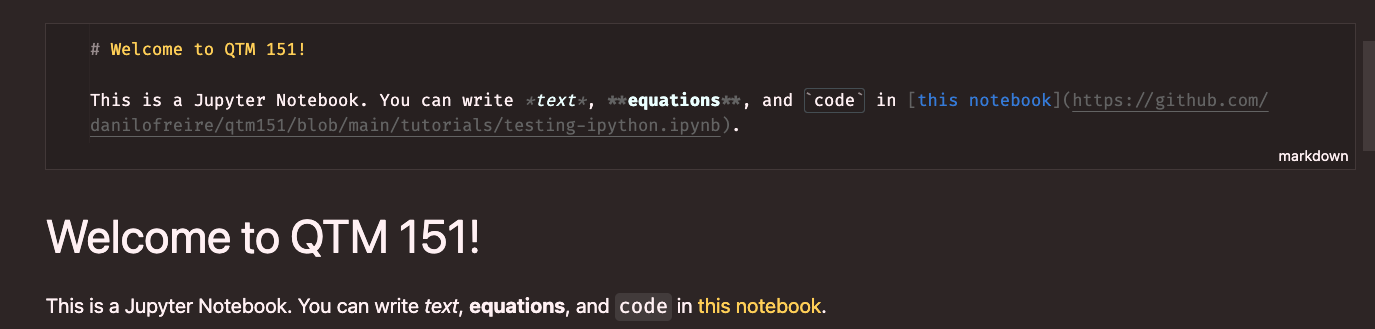
You can run the text cell by clicking the “Run” button on the left side of the box or by pressing “Shift + Enter” on your keyboard. The first text block shows how the text looks before running the cell, and the second block shows how it looks after running the cell. Just double click on the space where the text is to edit the Markdown block. This is should open the gray box again.
Introduction to Markdown
Why Use Markdown?
Markdown is a great way to format text because it is simple, easy to learn, and widely supported. You can use Markdown to create headings, lists, tables, equations, and figures in your documents. Markdown is used in many different applications, including Jupyter Notebook, GitHub, and Slack. Learning Markdown will help you create well-formatted documents that are easy to read and share.
Headings
You can create headings using the # symbol. For example, # Heading 1 creates a first-level heading, ## Heading 2 creates a second-level heading, and so on. You can create up to six levels of headings using the # symbol.
# Heading 1
## Heading 2
### Heading 3
Lists
To create an ordered list with nested unordered sub-items in Markdown, you can write the following code:
1. This is an ordered list.
2. This is the second item in the ordered list.
  - This is a sub-item in the unordered list.
- This is a sub-sub-item in the unordered list.- This is an ordered list.
- This is the second item in the ordered list.
- This is a sub-item in the unordered list.
- This is a sub-sub-item in the unordered list.
- This is a sub-item in the unordered list.
You can also create unordered lists:
- This is an unordered list.
- This is the second item in the unordered list.
- This is a sub-item in the unordered list.- This is an unordered list.
- This is the second item in the unordered list.
- This is a sub-item in the unordered list.
Tables
You can create tables using the | symbol. For example:
Table: Your Caption

| A            | New              | Table          |
|:-------------|:----------------:|---------------:|
|left-aligned  |centre-aligned    |right-aligned   |
|*italics* |~~strikethrough~~ |**boldface** || A | New | Table |
|---|---|---|
| left-aligned | centre-aligned | right-aligned |
| italics | boldface |
The : symbols in the second row of the table determine the alignment of the text in each column. You can use left, center, or right to align the text.
Creating Markdown Tables from Pandas DataFrames in Jupyter Notebooks
When working with pandas DataFrames, you can convert them into Markdown tables for better presentation. The method is also relatively simple. Here is how to do it:
Prerequisites
Ensure you have the following installed:
- Jupyter Notebook
pandastabulate(for enhanced table formatting)
Jupyter Notebook and pandas are included in the Anaconda distribution. You can install tabulate using conda install in your terminal. If you are using VS Code, you can open a terminal by clicking on “Terminal” > “New Terminal” in the top menu. Then run the following command:
conda install tabulateBasic Method: Using pandas.DataFrame.to_markdown()
pandas provides a built-in method to_markdown() for converting DataFrames to Markdown tables.
Step 1: Import pandas and create a DataFrame
You can create a dataframe by passing a dictionary to the pd.DataFrame() constructor:
# If necessary, install pandas and tabulate
# You should have pandas installed if you installed Anaconda,
# but if you do not, you can install both with the following terminal command:
# conda install pandas tabulate

# Import pandas
import pandas as pd
from tabulate import tabulate

# Create a sample DataFrame
data = {
    "Name": ["Alice", "Bob", "Charlie"],
    "Age": [25, 30, 35],
    "City": ["New York", "London", "Paris"]
}
df = pd.DataFrame(data)
Step 2: Convert DataFrame to Markdown
Then you just need to call the to_markdown() method on the DataFrame:
# Print the DataFrame as a Markdown table, excluding the index
markdown_table = df.to_markdown(index=False)
print(markdown_table)
This will output:
| Name    | Age  | City     |
|:--------|-----:|:---------|
| Alice   |   25 | New York |
| Bob     |   30 | London   |
| Charlie |   35 | Paris    |
Step 3: Display in Jupyter Notebook
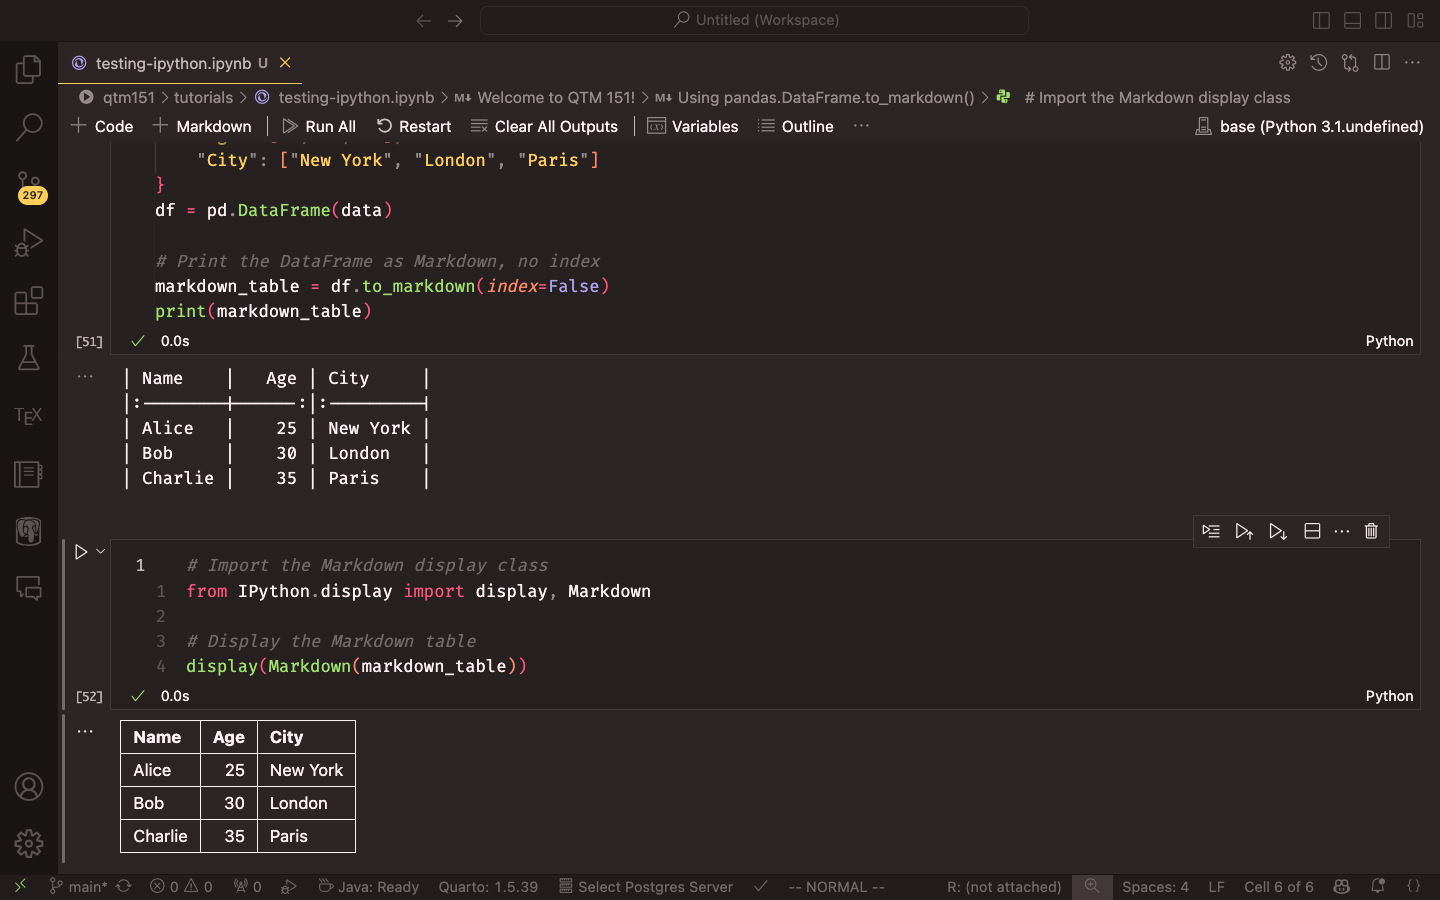
To display the Markdown table in a Jupyter Notebook cell, use the display() function from the IPython.display module:
# You should also have the IPython package installed if you installed Anaconda
# If not, you can install it with
# conda install ipython

# Import the Markdown display class.
# This is what allows us to display Markdown in Jupyter Notebooks
from IPython.display import display, Markdown

# Display the Markdown table
display(Markdown(markdown_table))
This will render a nicely formatted table in your notebook:
Advanced Formatting
You can customise the Markdown table using various parameters of to_markdown():
# Customising the Markdown table using the to_markdown() method
markdown_table = df.to_markdown(
    index=False,  # Don't include index
    tablefmt="pipe",  # Use pipe format
    floatfmt=".2f",  # Format floats to 2 decimal places
    headers=["Name", "Age (Years)", "City"],  # Custom headers
    colalign=("left", "center", "right")  # Align columns
)
display(Markdown(markdown_table))
Using tabulate for Enhanced Formatting
The tabulate library offers even more formatting options. While they are not necessary for basic tables, they can be useful for more complex tables. In our course, you will probably not need them, but I will show you how to use them for your reference. Please check their documentation for more information.
from tabulate import tabulate

markdown_table = tabulate(df, headers='keys', tablefmt='pipe', showindex=False)
display(Markdown(markdown_table))
Best Practices
Index: Consider whether you need the index in your table. Often, it is cleaner to exclude it using
index=False.Formatting: Use
floatfmtto control decimal places for numerical data.Headers: Customize headers for clarity, especially if your DataFrame column names are not user-friendly.
Table Format: Experiment with different
tablefmtoptions to find the most suitable for your needs.Large DataFrames: For large DataFrames, consider displaying only a subset of rows or columns to maintain readability.
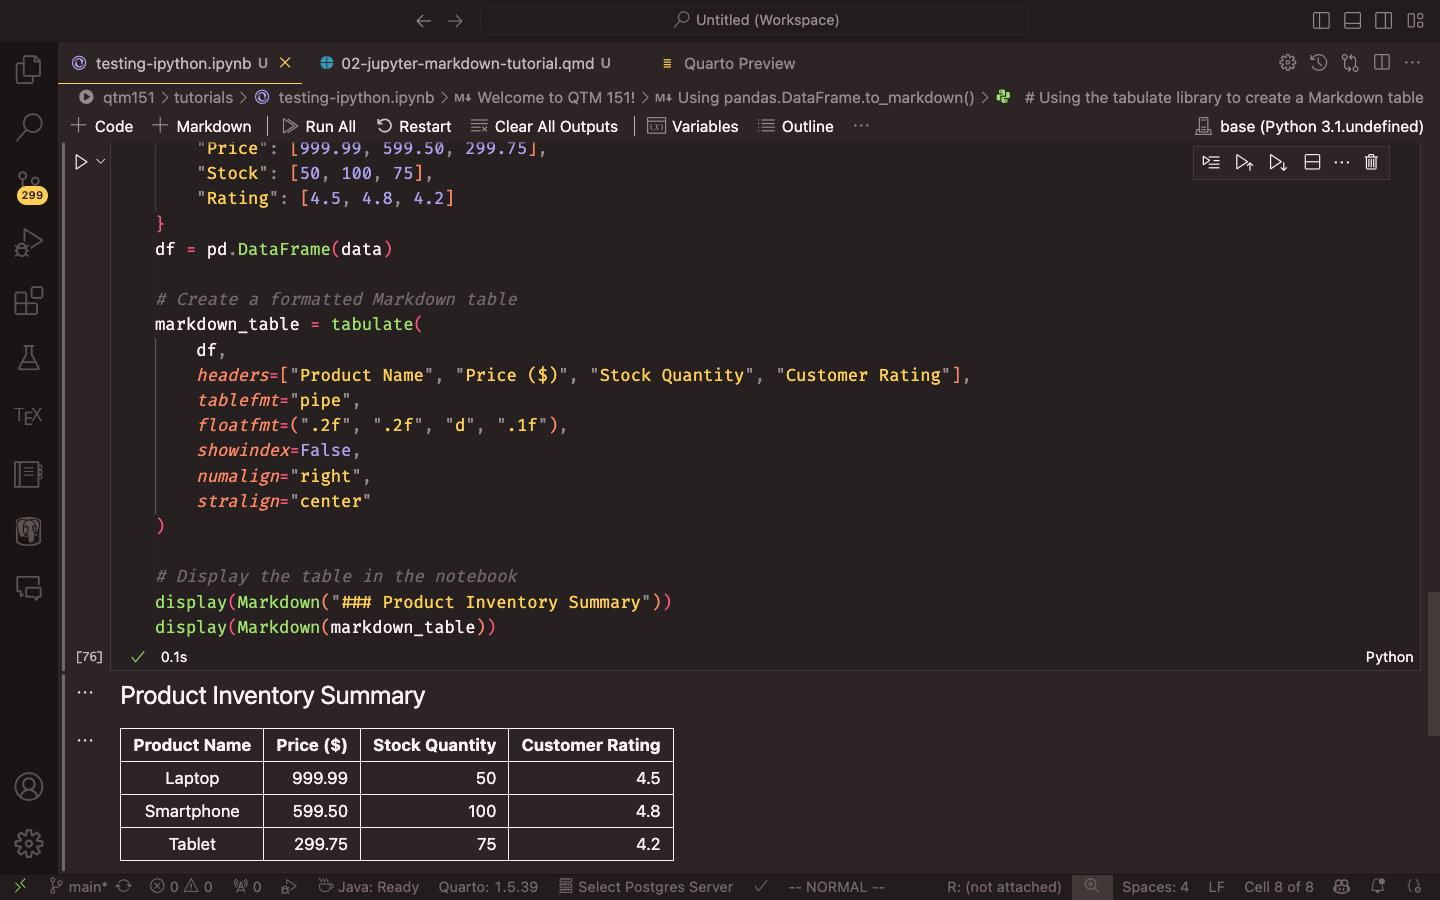
Example: Comprehensive Table Creation
Here is a more comprehensive example incorporating various best practices:
# Import necessary packages
import pandas as pd
from IPython.display import display, Markdown
from tabulate import tabulate

# Create a sample DataFrame
data = {
    "Product": ["Laptop", "Smartphone", "Tablet"],
    "Price": [999.99, 599.50, 299.75],
    "Stock": [50, 100, 75],
    "Rating": [4.5, 4.8, 4.2]
}
df = pd.DataFrame(data)

# Create a formatted Markdown table
markdown_table = tabulate(
    df,
    headers=["Product Name", "Price ($)", "Stock Quantity", "Customer Rating"],
    tablefmt="pipe", # Format as Markdown table
    floatfmt=(".2f", ".2f", "d", ".1f"),
    showindex=False, # Don't show the index (row numbers)
    numalign="right", # Align numbers to the right
    stralign="left" # Align strings (text, first column) to the left
)

# Display the table in the notebook
display(Markdown("### Product Inventory Summary"))
display(Markdown(markdown_table))
This will produce a well-formatted table with custom headers, appropriate number formatting, and a title.
Equations
You can create equations using the $$ symbol. For example in Equation 1, we have the formula for the standard deviation of a population:
$$
\sigma = \sqrt{\frac{\sum_{i=1}^{N} (x_i - \mu)^2}{N}}
$$ {#eq-stddev}
\[ \sigma = \sqrt{\frac{\sum_{i=1}^{N} (x_i - \mu)^2}{N}} \tag{1}\]
You can also create equations inline by using the $ symbol. For example, $\alpha = \beta + \gamma$ will render as \(\alpha = \beta + \gamma\). To learn more about how to write equations in using Markdown, you can refer to the Overleaf documentation.
Figures
You can include figures in your document using the {#fig-label} syntax. For example:
{#fig-label}This will include the image path/to/image.png in your document with the caption “This is a figure caption.” You can refer to the figure using the label fig-label, but this is optional.
If you are creating plots on Jupyter Notebook, the graphs will appear after the code cell that generates them.
Citations
Although Markdown has excellent reference support with BibTeX files, there is no reliable way to include citations automatically in Jupyter Notebooks. The two packages I know that manage citations, cite2c and Jupyterlab Citation Manager, are not ideal. The first has not been maintained for years, while the second is not ready for most uses. Therefore, I suggest simply copying the citation from Google Scholar and pasting it into a Markdown cell titled “References” at the end of your document. The same approach applies for inline citations.
Footnotes
Jupyter and Markdown support inline footnotes1. To create a footnote, simply add a caret and brackets with a label inside, like this: [^label]. Then, you can define the footnote content anywhere in the document using the same label followed by a colon2. I usually include them at the end of a paragraph. Jupyter will automatically number and format your footnotes for you.
Conclusion
I hope you find this tutorial helpful and that you can use Jupyter Notebook and Markdown to create beautiful documents. If you have any questions or feedback, please feel free to reach out to me. Happy coding! :)