class: center, middle, inverse, title-slide # Week 06 - Prediction ## Election Polls and For Loops <html> <div style="float:left"> </div> <hr color='#EB811B' size=1px width=800px> </html> ### Danilo Freire ### 1st of March 2019 --- <style> .remark-slide-number { position: inherit; } .remark-slide-number .progress-bar-container { position: absolute; bottom: 0; height: 6px; display: block; left: 0; right: 0; } .remark-slide-number .progress-bar { height: 100%; background-color: #EB811B; } .orange { color: #EB811B; } </style> # Today's Agenda .font150[ * Why is prediction important? * Election prediction, 538-style * For Loops * Conditional statements (time permitting) ] --- class: inverse, center, middle # Prediction <html><div style='float:left'></div><hr color='#EB811B' size=1px width=720px></html> --- class: clear background-image: url(antikythera01.png) --- # Antikythera Mechanism .center[] --- # Antikythera Mechanism .center[] --- # Paul the Octopus .center[] --- # Canada Flu Activity .center[] --- # Coups d'État .center[] --- # Mass Killings .center[] --- # Mass Killings .center[] --- # 2008 US Presidential Election .font130[ * Barack Obama won 52.9% of the national votes while McCain won 45.7% * Polls fluctuate early but very accurate at the end ] .center[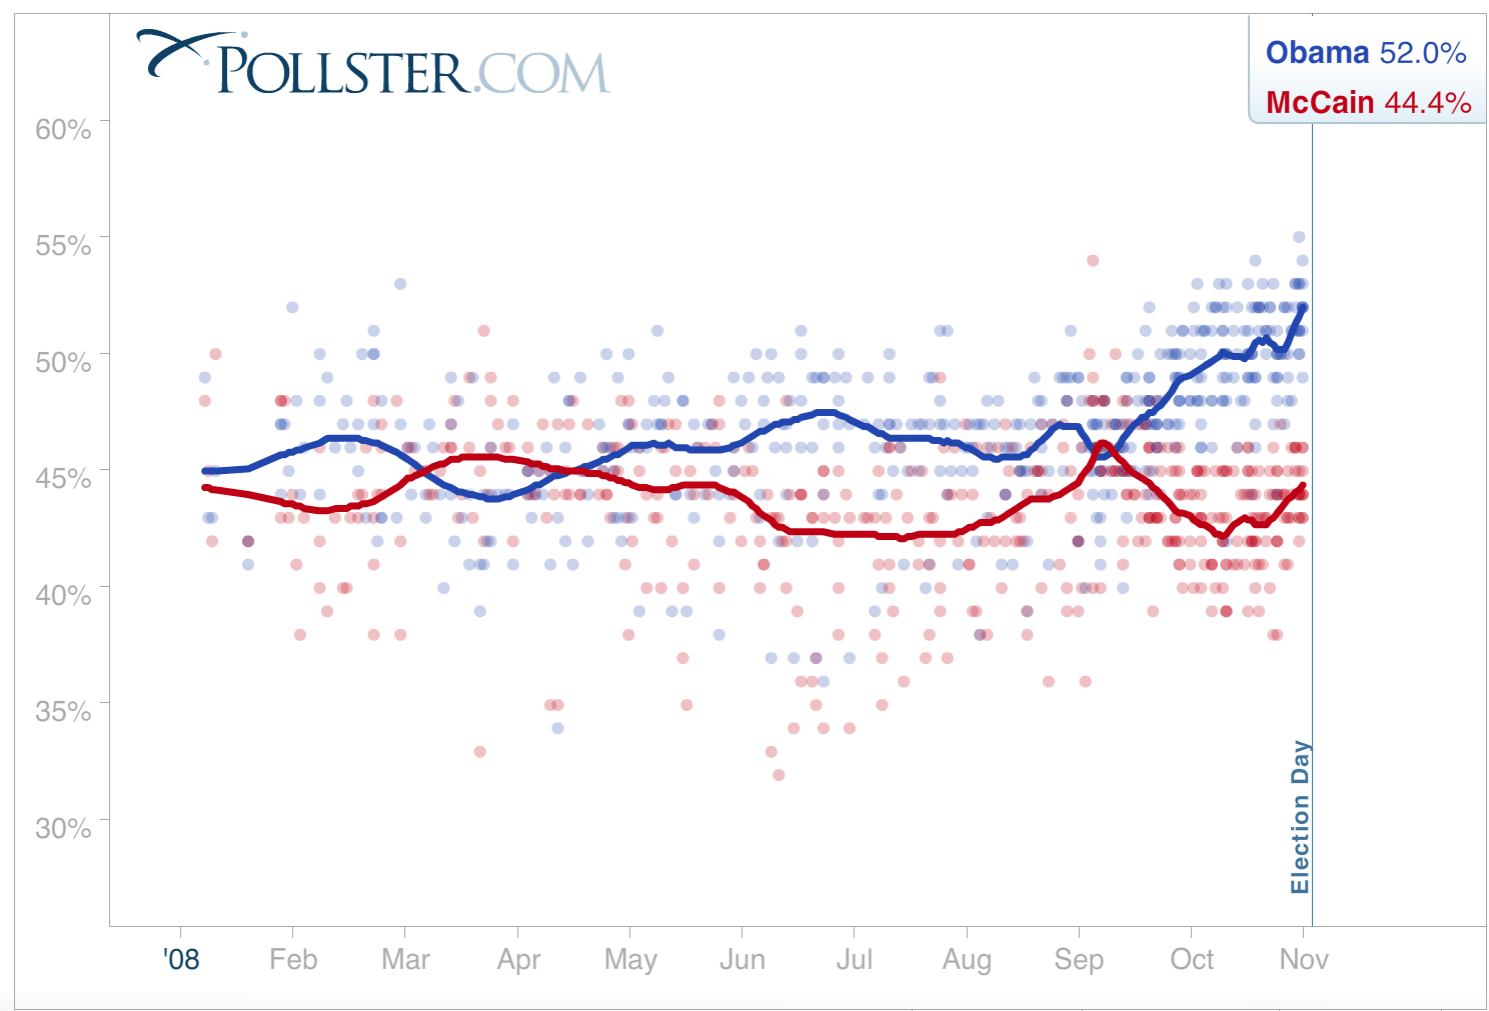] --- # 2012 US Presidential Election .font150[ * Obama: 51.1% (polls: 48.2%) * Romney: 47.2% (polls: 46.7%) ] .center[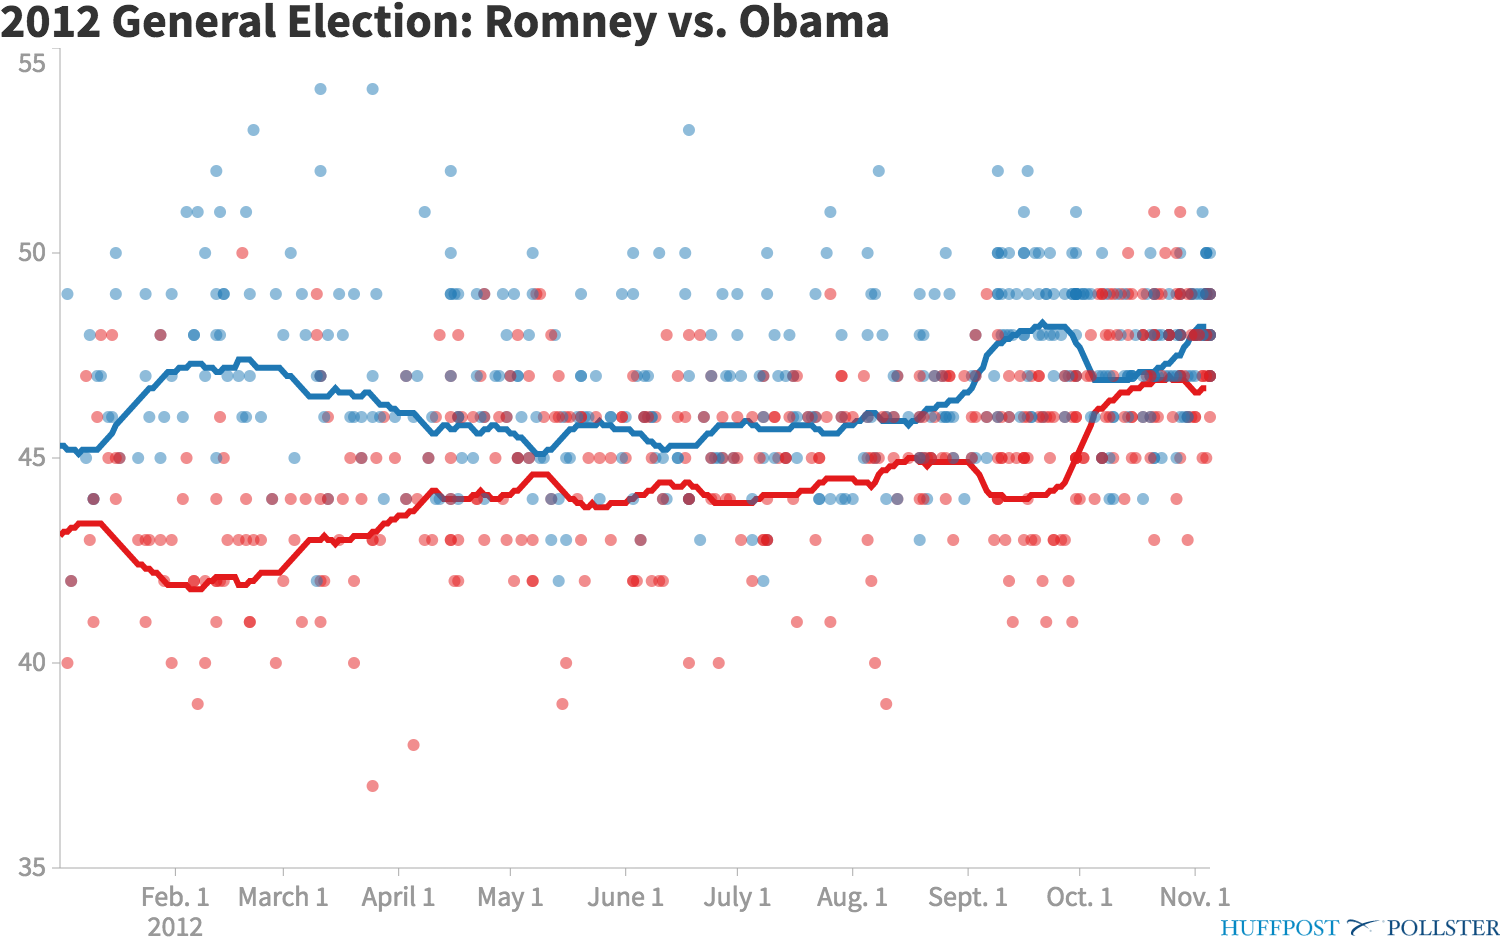] --- # How Should We "Forecast" Elections? .font110[ * Macro political and economic fundamentals for early forecasting ] .center[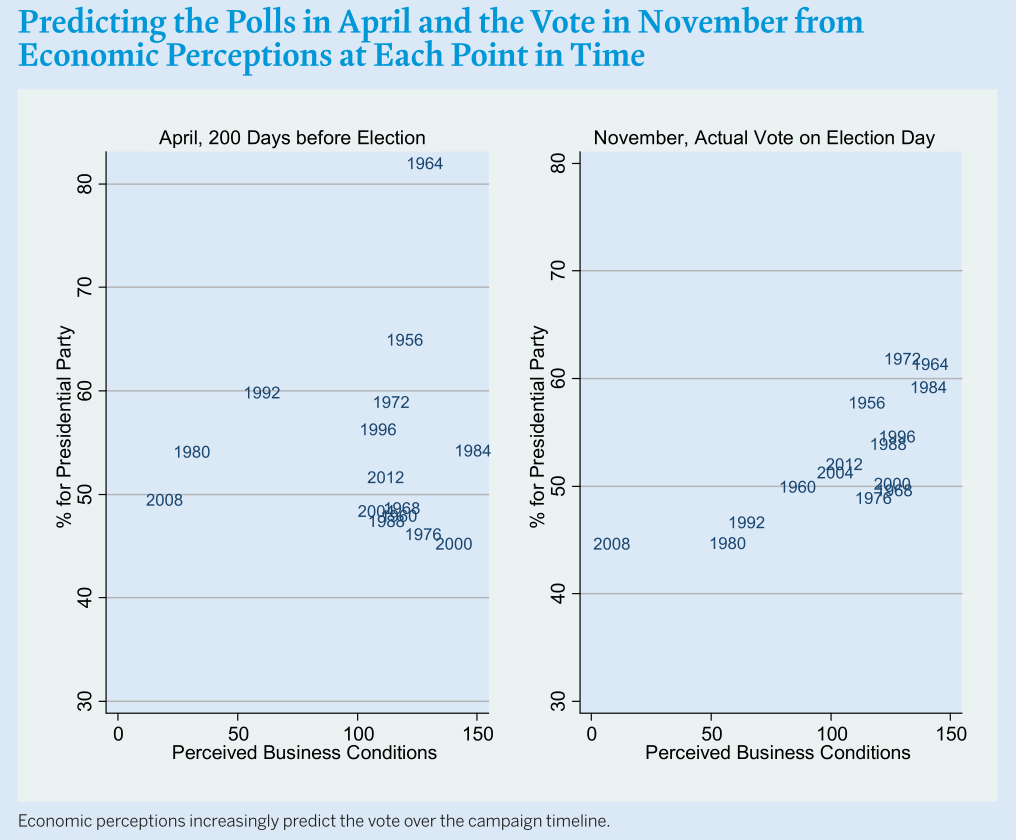] .font110[ * Recent method: combine them with polls ] --- # Let's Analyse Some Polls .font120[ * We will use a nice `R` package called `pollstR`, which scrapes the data from Huffington Post: ] .center[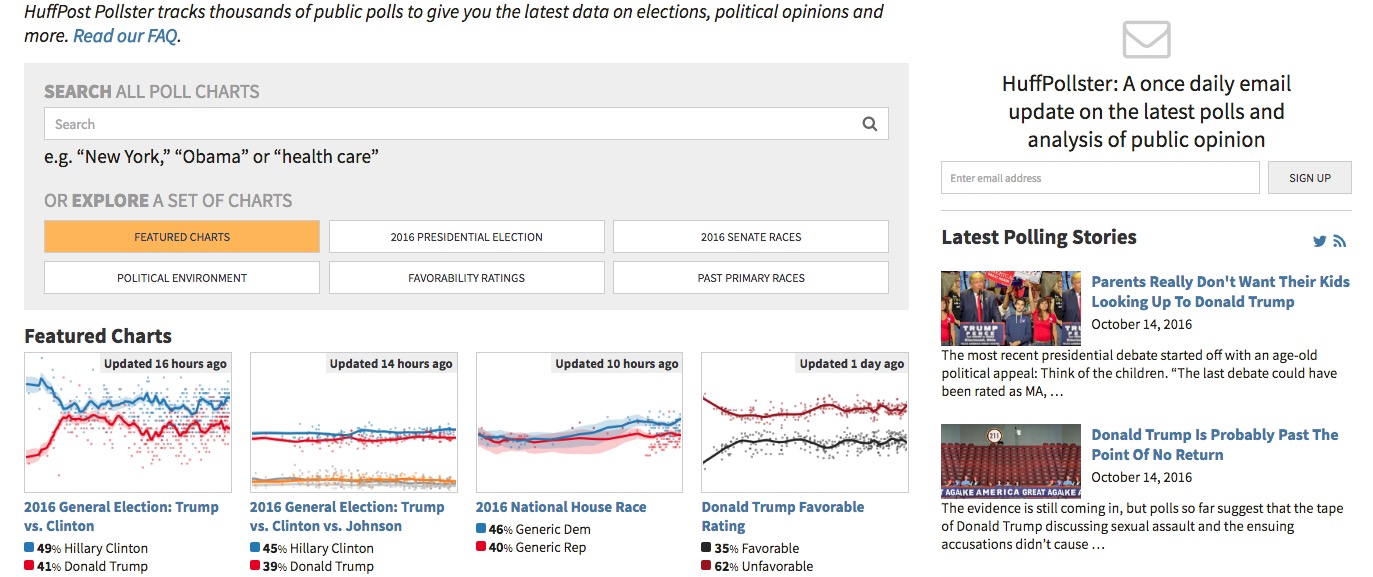] --- # Let's Analyse Some Polls .font150[ * Only a few lines of code does it: ] ```r library(pollstR) chart_name <- "2016-general-election-trump-vs-clinton" polls2016 <- pollster_charts_polls(chart_name)[["content"]] polls2016 <- as.data.frame(polls2016) names(polls2016) ``` ``` ## [1] "Trump" "Clinton" "Other" ## [4] "Undecided" "poll_slug" "survey_house" ## [7] "start_date" "end_date" "question_text" ## [10] "sample_subpopulation" "observations" "margin_of_error" ## [13] "mode" "partisanship" "partisan_affiliation" ``` ```r polls2016[1:3, c("Trump", "Clinton", "start_date", "end_date")] ``` ``` ## Trump Clinton start_date end_date ## 1 43 46 2016-11-04 2016-11-06 ## 2 39 44 2016-11-02 2016-11-06 ## 3 43 47 2016-11-02 2016-11-06 ``` --- # Plotting Polls over Time .font150[ * Compute the days to the election variable ] ```r class(polls2016$end_date) ``` ``` ## [1] "Date" ``` ```r polls2016$DaysToElection <- as.Date("2016-11-8") - polls2016$end_date ``` .font150[ * Plot results ] ```r plot(polls2016$DaysToElection, polls2016$Clinton, xlab = "Days to the Election", ylab = "Support", xlim = c(550, 0), ylim = c(25, 65), pch = 19, col = "blue") points(polls2016$DaysToElection, polls2016$Trump, pch = 20, col = "red") ``` --- # Plotting Polls over Time <img src="week06c_files/figure-html/hp04-1.png" style="display: block; margin: auto;" /> .font130[ .center[What's wrong with this plot?] ] --- # Plotting Polls over Time <img src="week06c_files/figure-html/hp05-1.png" style="display: block; margin: auto;" /> .font130[ .center[Time series looks even worse] ] --- # Smoothing over Time .font140[ * .orange[Moving average]: average polls within a one-week period ] -- .font140[ * For example, on 17th of October, we will take all polls conducted within the past week ] -- .font140[ * Window size: amount of smoothing ] -- .font140[ * Coding strategy: for each day, we subset the relevant polls and compute the average ] -- .font140[ * Range of the `DaysToElection` variable: ] ```r range(polls2016$DaysToElection) ``` ``` ## Time differences in days ## [1] 2 532 ``` --- # For Loops in R .font120[ * Basic structure ] ```r for (i in X) { expression1 expression2 ... expressionN } ``` .font120[ * Elements of a loop - `i`: counter (can use any object name other than `i`) - `X`: vector containing a set of ordered values the counter takes - `expression`: a set of expressions that will be repeatedly evaluated - `{ }`: curly braces to define the beginning and the end * Indentation is important for the readability of code ] --- # For Loops in R .font150[ * .orange[Tip]: Code without loop first by setting the counter to a specific value ] ```r values <- c(2, 4, 6) i <- 1 x <- values[i] * 3 cat(values[i], "times 3 is equal to", x, "\n") ``` ``` ## 2 times 3 is equal to 6 ``` --- # For Loops in R .font150[ * Step by step: ] ```r # our vector values <- c(2, 4, 6) # empty vector for storing the results results <- rep(NA, length(values)) # counter `i' will take values on 1, 2, ..., length(values) in that order for (i in 1:length(values)) { # store the result as the ith element of `results' vector results[i] <- values[i] * 3 # print the values, you will not see this cat(values[i], "times 3 is equal to", results[i], "\n") } ``` ``` ## 2 times 3 is equal to 6 ## 4 times 3 is equal to 12 ## 6 times 3 is equal to 18 ``` --- # For Loops in R .font150[ * Printing out an iteraction number can be helpful for debugging ] ```r values <- c(1, -1, 2) results <- rep(NA, 3) for (i in 1:3) { cat("iteration", i, "\n") results[i] <- log(values[i]) } ``` ``` ## iteration 1 ## iteration 2 ``` ``` ## Warning in log(values[i]): NaNs produced ``` ``` ## iteration 3 ``` --- # 7-Day Moving Average ```r # Days days <- 532:2 # Set a 7-day moving average window window <- 7 # Fill two vectors with NAs Clinton.pred <- Trump.pred <- rep(NA, length(days)) # Loop for (i in 1:length(days)) { week.data <- subset(polls2016, subset = ((DaysToElection < (days[i] + window)) & (DaysToElection >= days[i]))) Clinton.pred[i] <- mean(week.data$Clinton) Trump.pred[i] <- mean(week.data$Trump) } # Plot plot(days, Clinton.pred, type = "l", col = "blue", xlab = "Days to the Election", ylab = "Support", xlim = c(550, 0), ylim = c(25, 65)) lines(days, Trump.pred, col = "red") ``` --- # 7-Day Moving Average <img src="week06c_files/figure-html/pres02-1.png" style="display: block; margin: auto;" /> .font130[ .center[Maybe we should try another window] ] --- # 3-Day Moving Average ```r # Days days <- 532:2 # 3-day moving averages window <- 3 # Empty vectors Clinton.pred <- Trump.pred <- rep(NA, length(days)) # Loop for (i in 1:length(days)) { week.data <- subset(polls2016, subset = ((DaysToElection < (days[i] + window)) & (DaysToElection >= days[i]))) Clinton.pred[i] <- mean(week.data$Clinton) Trump.pred[i] <- mean(week.data$Trump) } # Plot plot(days, Clinton.pred, type = "l", col = "blue", xlab = "Days to the Election", ylab = "Support", xlim = c(550, 0), ylim = c(25, 65)) lines(days, Trump.pred, col = "red") ``` --- # 3-Day Moving Average <img src="week06c_files/figure-html/pres04-1.png" style="display: block; margin: auto;" /> .font130[ .center[Maybe we should try _yet another_ window] ] --- # 2-Week Moving Average <img src="week06c_files/figure-html/pres05-1.png" style="display: block; margin: auto;" /> .font130[ .center[It's getting better!] ] --- # Let’s Add Some Informative Labels .font150[ * Candidate names ] ```r text(400, 50, "Clinton", col = "blue") text(400, 40, "Trump", col = "red") ``` .font150[ * Events: party conventions and debates ] ```r text(200, 60, "party\n conventions") abline(v = as.Date("2016-11-8") - as.Date("2016-7-28"), lty = "dotted", col = "blue") abline(v = as.Date("2016-11-8") - as.Date("2016-7-21"), lty = "dotted", col = "red") text(60, 30, "debates") abline(v = as.Date("2016-11-8") - as.Date("2016-9-26"), lty = "dashed") abline(v = as.Date("2016-11-8") - as.Date("2016-10-9"), lty = "dashed") ``` --- # Let’s Add Some Informative Labels <img src="week06c_files/figure-html/unnamed-chunk-1-1.png" style="display: block; margin: auto;" /> .font130[ .center[Looks pretty good!] ] --- class: inverse, center, middle # Questions? <html><div style='float:left'></div><hr color='#EB811B' size=1px width=720px></html> --- class: inverse, center, middle # Have A Great Weekend! <html><div style='float:left'></div><hr color='#EB811B' size=1px width=720px></html>