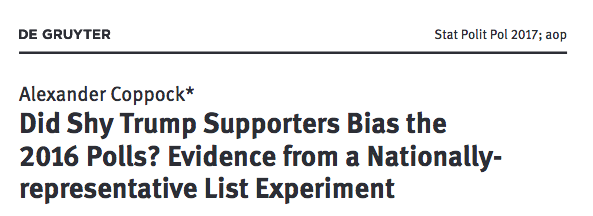
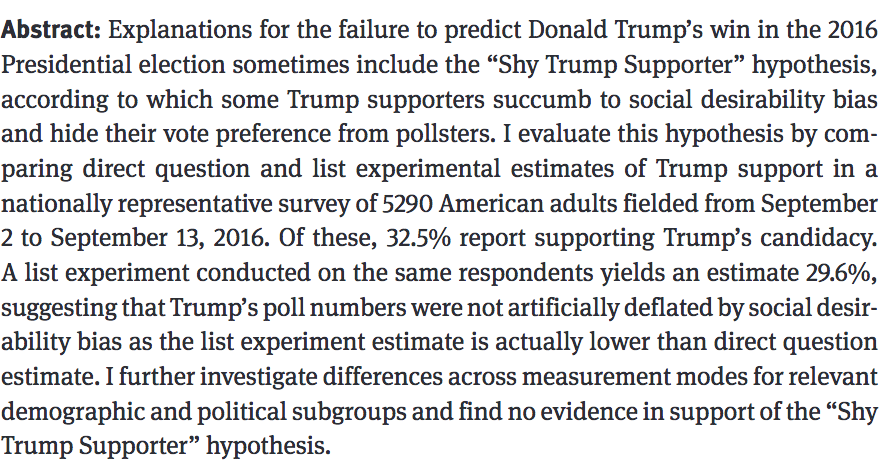
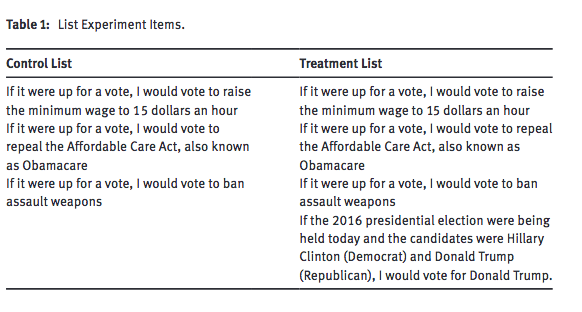
class: center, middle, inverse, title-slide # Week 05 - Measurement ## Survey Biases and List Experiments <html> <div style="float:left"> </div> <hr color='#EB811B' size=1px width=800px> </html> ### Danilo Freire ### 20th February 2019 --- <style> .remark-slide-number { position: inherit; } .remark-slide-number .progress-bar-container { position: absolute; bottom: 0; height: 6px; display: block; left: 0; right: 0; } .remark-slide-number .progress-bar { height: 100%; background-color: #EB811B; } .orange { color: #EB811B; } </style> # Today's Agenda .font150[ * Brief recap * Social desirability bias * List experiments * Final project ] --- # Descriptive Statistics .font150[ * Quantiles, quartiles, median, IQR, SD * Standard deviation: average distance from points to the mean - `\(SD = \sqrt{\frac{1}{n} \sum^{n}_{i = 1} (x_{i} - \bar{x})^{2}}\)` * Outliers: 1.5x IQR * Median is robust to outliers * When `\(n\)` is large, mean and median are roughly the same ] --- # Bar Plots .font150[ * Bar plots, histograms, box plots * Bar plots: - Describe factor variables - `barplot(prop.table(table(dataset$variable)))` ] --- # Bar Plots ```r afghan <- read.csv("https://raw.githubusercontent.com/pols1600/pols1600.github.io/master/datasets/measurement/afghan.csv") barplot(prop.table(table(afghan$violent.exp.taliban)), main = "Taliban Victimisation Rate") ``` <img src="week05b_files/figure-html/unnamed-chunk-1-1.png" style="display: block; margin: auto;" /> --- # Histograms .font150[ * Histograms - Describe numeric variables - Show the shape of the variable distribution - Densities are .orange[not] percentiles - Densities are the proportion of _each bin_ - `hist(dataset$variable, freq = FALSE)` ] --- # Histograms ```r hist(afghan$age, main = "Age Distribution", freq = FALSE) ``` <img src="week05b_files/figure-html/unnamed-chunk-2-1.png" style="display: block; margin: auto;" /> --- # Box Plots .font150[ * Box plots - Distribution of a numeric variable - Quartiles, median, IQR, outliers - `boxplot(variable ~ group)` (where `~ group` is optional) ] --- # Box Plots ```r boxplot(afghan$age ~ afghan$province, main = "Age Distribution by province") ``` <img src="week05b_files/figure-html/unnamed-chunk-3-1.png" style="display: block; margin: auto;" /> --- # Survey Biases .font150[ * Last week we discussed two types of biases: - Individual non-response - Item non-response ] --- # Survey Biases .font150[ * Quota sampling versus random sampling * Quote sampling doesn't control for .orange[unobservables] * Random sampling produces groups identical on average * Difficulties: - Some individuals have more chances of being selected - Costs ] --- # Social Desirability Bias .font150[ * Respondents sometimes do not state their true preferences * Examples: support for drug use, abortion, etc * Under- or overestimation of true proportion ] --- # List Experiments .font150[ * .orange[List experiments] can minimise the problem * Grant anonymity to respondents * Control group sees a list of statements * Treatment group sees the same list _plus a sensitive item_ * _Assuming that respondents don't lie and that both groups would answer the same number of non-sensitive items_, we can infer their true preferences ] --- # Racial Attitudes .font150[ * Example based on Graeme Blair and Kosuke Imai, 2012, [Statistical Analysis of List Experiments](https://www.jstor.org/stable/41403738), _Political Analysis_ 20(1), 47-77. ] --- # Racial Attitudes .font150[ * Control group: Now I’m going to read you three things that sometimes make people angryor upset. After I read all three, just tell me HOW MANY of them upset you. (I don’t want to know which ones, just how many.) 1) "the federal government increasing the tax on gasoline;" 2) "professional athletes getting million-dollar-plus salaries;" 3) "large corporations polluting the environment." How many, if any, of these things upset you? ] --- # List experiments .font130[ * Treatment group: Now I’m going to read you three things that sometimes make people angryor upset. After I read all three, just tell me HOW MANY of them upset you. (I don’t want to know which ones, just how many.) 1) "the federal government increasing the tax on gasoline;" 2) "professional athletes getting million-dollar-plus salaries;" 3) "large corporations polluting the environment." .orange[4) "a black family moving next door to you."] How many, if any, of these things upset you? ] --- # Racial Attitudes ```r library(list) data(race) summary(race) ``` ``` ## y treat age south ## Min. :0.000 Min. :0.0000 Min. :1.800 Min. :0.000 ## 1st Qu.:2.000 1st Qu.:0.0000 1st Qu.:3.000 1st Qu.:0.000 ## Median :2.000 Median :1.0000 Median :4.000 Median :0.000 ## Mean :2.169 Mean :0.5144 Mean :4.273 Mean :0.235 ## 3rd Qu.:3.000 3rd Qu.:1.0000 3rd Qu.:5.200 3rd Qu.:0.000 ## Max. :4.000 Max. :1.0000 Max. :8.800 Max. :1.000 ## ## male college state ## Min. :0.0000 Min. :0.0000 CA :130 ## 1st Qu.:0.0000 1st Qu.:0.0000 TX : 67 ## Median :0.0000 Median :1.0000 PA : 64 ## Mean :0.4402 Mean :0.5804 FL : 63 ## 3rd Qu.:1.0000 3rd Qu.:1.0000 IL : 62 ## Max. :1.0000 Max. :1.0000 NY : 62 ## (Other):765 ``` --- # Racial Attitudes ```r round(mean(race$y[race$treat == 1]) - mean(race$y[race$treat == 0]), 4) ``` ``` ## [1] 0.0678 ``` ```r diff.in.means <- ictreg(y ~ 1, data = race, treat = "treat", J = 3, method = "lm") summary(diff.in.means) ``` ``` ## ## Item Count Technique Regression ## ## Call: ictreg(formula = y ~ 1, data = race, treat = "treat", J = 3, ## method = "lm") ## ## Sensitive item ## Est. S.E. ## (Intercept) 0.0678 0.04962 ## ## Control items ## Est. S.E. ## (Intercept) 2.13413 0.03317 ## ## Residual standard error: 0.866365 with 1211 degrees of freedom ## ## Number of control items J set to 3. Treatment groups were indicated by '' and '' and the control group by ''. ``` --- # Shy Trump Supporter .center[] Coppock, Alexander. 2017. [Did Shy Trump Supporters Bias the 2016 Polls? Evidence from a Nationally-representative List Experiment]( https://alexandercoppock.com/papers/Coppock_shytrump.pdf). Statistics, Politics, and Policy. 8(1):29-40 --- # Shy Trump Supporter .center[] --- # Shy Trump Supporter .center[] --- # Shy Trump Supporter .center[] --- class: inverse, center, middle # Questions? <html><div style='float:left'></div><hr color='#EB811B' size=1px width=720px></html> --- class: inverse, center, middle # Final Project <html><div style='float:left'></div><hr color='#EB811B' size=1px width=720px></html> --- # Final Project .font150[ * Due: 29th of April * 50% of final grade * Groups of 3 or 4. Please send me your groups until .orange[this Friday] * 15-page essay (_not_ including R code and graphs) and a 10-minute presentation ] --- # Final Project .font150[ * Randomised control trials or observational designs * Topics of your choosing * If you can find an article about it, the better * Deadline? ] --- # Final Project .font150[ * Essay: - Introduction: relevance, brief summary of results - (Short) Literature Review: theoretical puzzle - Data: descriptive statistics and graphs - Results: methods and results - Discussion: conclusion, shortcomings, future extensions - References ] --- # Final Project .font150[ * Presentation: - Same format, about 10 minutes long - Please send me a pdf with the slides before the due date - Bonus point if you can make [your presentation in Rmarkdown](https://bookdown.org/yihui/rmarkdown/beamer-presentation.html) (_you don't have to_) ] --- class: inverse, center, middle # See you on Friday! <html><div style='float:left'></div><hr color='#EB811B' size=1px width=720px></html>