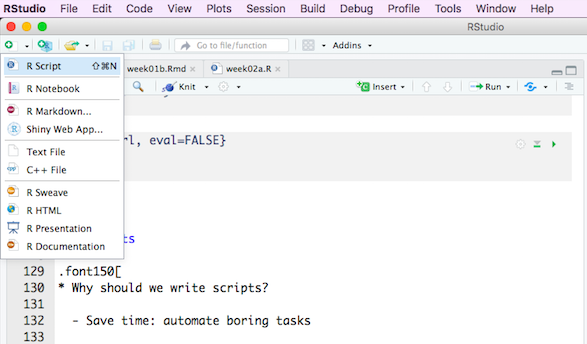
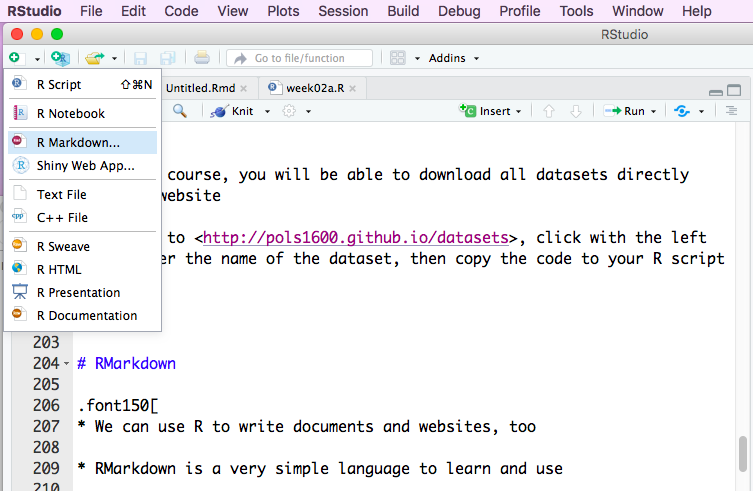
class: center, middle, inverse, title-slide # Week 02 - More Introduction to R ## Writing Scripts and Reading Data Files <html> <div style="float:left"> </div> <hr color='#EB811B' size=1px width=800px> </html> ### Danilo Freire ### 28th January 2019 --- <style> .remark-slide-number { position: inherit; } .remark-slide-number .progress-bar-container { position: absolute; bottom: 0; height: 6px; display: block; left: 0; right: 0; } .remark-slide-number .progress-bar { height: 100%; background-color: #EB811B; } .orange { color: #EB811B; } </style> # Today's Agenda .font150[ * Course website * Brief recap * Questions about `swirl()` * Create and run R scripts * Read `.csv` datasets * Homework: install RMarkdown and write your first document ] --- # Course website .font150[ * The course website has a new address: * <http://pols1600.github.io> * Syllabus, lecture slides, R scripts, assignments, datasets * Updated syllabus at <https://cab.brown.edu/> * [danilo_freire@brown.edu](mailto:danilo_freire@brown.edu) ] --- # Brief recap .font150[ * Last week you learned how to: - Install R and RStudio - Do arithmetic operations in R - Manipulate vectors - Install packages from CRAN - Use `swirl()` - Do the course exercises ] --- # Brief recap ```r (2^5)*3.5 ``` ``` ## [1] 112 ``` ```r vec <- seq(from = 1, to = 100, by = 2) vec[c(5:10)] ``` ``` ## [1] 9 11 13 15 17 19 ``` ```r summary(vec) ``` ``` ## Min. 1st Qu. Median Mean 3rd Qu. Max. ## 1.0 25.5 50.0 50.0 74.5 99.0 ``` ```r install.packages("congressbr") ``` ``` ## ## The downloaded binary packages are in ## /var/folders/nl/c_4v70mj40g0y7p_9vb6r68r0000gq/T//RtmpV1L5k9/downloaded_packages ``` ```r library("swirl") ``` ```r swirl() # R won't read this line ``` --- # Swirl .font150[ * Questions? ] --- # R scripts .font150[ * Why should we write scripts? - Save time: automate boring tasks - Reproducibility - Allow complex tasks to be performed in small steps - Faster to run ] --- # R scripts .center[] --- # Read data files .font150[ * R can read files of many types and formats * Usually, data are either in `.csv` or `.Rdata` format * R can also read Excel spreadsheets with the [readxl package](https://readxl.tidyverse.org/) ] --- # Read csv files .center[ .font200[ name_object <- read.csv("data_path/file.csv") ] ] --- # Read csv files ```r *df <- read.csv("/Users/politicaltheory/Documents/github/pols1600.github.io/datasets/turnout.csv") summary(df) ``` ``` ## year VEP VAP total ## Min. :1980 Min. :159635 Min. :164445 Min. : 64991 ## 1st Qu.:1986 1st Qu.:171192 1st Qu.:178930 1st Qu.: 73179 ## Median :1993 Median :181140 Median :193018 Median : 89055 ## Mean :1993 Mean :182640 Mean :194226 Mean : 89778 ## 3rd Qu.:2000 3rd Qu.:193353 3rd Qu.:209296 3rd Qu.:102370 ## Max. :2008 Max. :213314 Max. :230872 Max. :131304 ## ## ANES felons noncit overseas ## Min. :47.00 Min. : 802 Min. : 5756 Min. :1803 ## 1st Qu.:57.00 1st Qu.:1424 1st Qu.: 8592 1st Qu.:2236 ## Median :70.50 Median :2312 Median :11972 Median :2458 ## Mean :65.79 Mean :2177 Mean :12229 Mean :2746 ## 3rd Qu.:73.75 3rd Qu.:3042 3rd Qu.:15910 3rd Qu.:2937 ## Max. :78.00 Max. :3168 Max. :19392 Max. :4972 ## ## osvoters ## Min. :263 ## 1st Qu.:263 ## Median :263 ## Mean :263 ## 3rd Qu.:263 ## Max. :263 ## NA's :13 ``` --- # Read csv files from the internet ```r *df <- read.csv("https://raw.githubusercontent.com/pols1600/pols1600.github.io/master/datasets/turnout.csv") summary(df) ``` ``` ## year VEP VAP total ## Min. :1980 Min. :159635 Min. :164445 Min. : 64991 ## 1st Qu.:1986 1st Qu.:171192 1st Qu.:178930 1st Qu.: 73179 ## Median :1993 Median :181140 Median :193018 Median : 89055 ## Mean :1993 Mean :182640 Mean :194226 Mean : 89778 ## 3rd Qu.:2000 3rd Qu.:193353 3rd Qu.:209296 3rd Qu.:102370 ## Max. :2008 Max. :213314 Max. :230872 Max. :131304 ## ## ANES felons noncit overseas ## Min. :47.00 Min. : 802 Min. : 5756 Min. :1803 ## 1st Qu.:57.00 1st Qu.:1424 1st Qu.: 8592 1st Qu.:2236 ## Median :70.50 Median :2312 Median :11972 Median :2458 ## Mean :65.79 Mean :2177 Mean :12229 Mean :2746 ## 3rd Qu.:73.75 3rd Qu.:3042 3rd Qu.:15910 3rd Qu.:2937 ## Max. :78.00 Max. :3168 Max. :19392 Max. :4972 ## ## osvoters ## Min. :263 ## 1st Qu.:263 ## Median :263 ## Mean :263 ## 3rd Qu.:263 ## Max. :263 ## NA's :13 ``` --- # Read csv files from the internet .font150[ * In this course, you will be able to download all datasets directly from our website * Just go to <http://pols1600.github.io/datasets>, click with the left buttom over the name of the dataset, then copy the code to your R script ] --- # RMarkdown .font150[ * We can use R to write documents and websites, too * RMarkdown is a very simple language to learn and use * You should submit your assignments and final project in RMarkdown format * Visit <https://rmarkdown.rstudio.com/lesson-1.html> for an introduction ] --- # RMarkdown .center[] --- # RMarkdown basics .font120[ Add `fontsize: 12pt` to the header (the section above `---`) Basic commands: `# Section` `## Subsection` Formatting: `*italics*` `**boldface**` Weblink: `[POLS1600 website](http://pols1600.github.io)` Image: `` ] --- # RMarkdown .font150[ Lists: ] .center[] .font150[ You need to add four spaces or one tab to write sub-items ] --- # RMarkdown .font135[ R code: ` ```{r}` `library(swirl)` ` ``` ` Just click on the `insert` buttom to add code ] .center[] .font135[ Then press the `knit` buttom to see your document ] --- # Homework .font130[ * Install LaTeX: <https://www.latex-project.org/get/> (it is a _big_ file, ~2Gb) * Download this pdf: <https://www.rstudio.com/wp-content/uploads/2015/02/rmarkdown-cheatsheet.pdf> * Create a new RMarkdown document * If RStudio asks you to download some packages, click `yes` * Write a few paragraphs and add this code to the file: ] .font120[ a <- seq(1:10) b <- a*a plot(a, b) ] --- # Homework .center[] --- # Homework .center[] --- class: inverse, center, middle # See you on Wednesday! <html><div style='float:left'></div><hr color='#EB811B' size=1px width=720px></html>