class: center, middle, inverse, title-slide # POLS 1600 - Political Research Methods ## Week 01 - Introduction <html> <div style="float:left"> </div> <hr color='#EB811B' size=1px width=800px> </html> ### Danilo Freire ### 23rd January 2019 --- <style> .remark-slide-number { position: inherit; } .remark-slide-number .progress-bar-container { position: absolute; bottom: 0; height: 6px; display: block; left: 0; right: 0; } .remark-slide-number .progress-bar { height: 100%; background-color: #EB811B; } .orange { color: #EB811B; } </style> # Introduction .font180[**Danilo Freire**] .font120[ * Eu sou brasileiro * Masters from the Graduate Institute Geneva * PhD in Political Economy at King's College London * Post-doctoral research fellow in the Political Theory Project * Political violence, collective action, experimental methods, machine learning * [http://danilofreire.github.io](http://danilofreire.github.io) * [danilo_freire@brown.edu](mailto:danilo_freire@brown.edu) ] --- background-image: url(neymar.jpg) class: clear --- background-image: url(carnaval.jpg) class: clear --- background-image: url(rio.jpg) class: clear --- class: inverse, center, middle # What about you? <html><div style='float:left'></div><hr color='#EB811B' size=1px width=720px></html> --- # Introduce yourself .font150[ * What is your name? * Where do you come from? * Tell me something I don't know about your city or country * Why are you taking this course? ] --- class: inverse, center, middle # POLS 1600 <html><div style='float:left'></div><hr color='#EB811B' size=1px width=720px></html> --- # Logistics .font150[ * We meet every Monday, Wednesday and Friday at 13:00 in the [CIT Centre (Thomas Watson CTI) 227](http://brown.edu/Facilities/Facilities_Management/maps/index.php#building/WATSONCIT) * All course information will be available at [http://danilofreire.github.io/pols1600](http://danilofreire.github.io/pols1600) * Syllabus will probably be updated throughout the course (but not much) * Office hours: at your convenience (just e-mail me first) * Office address: [8 Fones Alley, first floor, office 114](https://goo.gl/maps/MRQNS9EC9Qv) ] --- # Textbooks .center[] --- # Textbooks .center[] --- # Learning Objectives .font120[ * Be a critical consumer of statistical information ] -- .font120[ * Be a critical _producer_ of statistical information ] -- .font120[ * Learn how to code ] -- .font120[ * Learn how to use R for quantitative analysis ] -- .font120[ * Learn the basics of data visualisation ] -- .font120[ * Estimate the relationship among many variables of interest using statistical models (OLS) ] -- .font120[ * .orange[Have a good time with your colleagues] ] --- # Grading .font150[ * **Participation**: 10% * **Problem Sets**: 40% * **Final Project**: 50% ] -- .font150[ * _No exams_ ] -- .font150[ * Read the materials and do the exercises _before_ class ] --- # Resources .font150[ * This course is relatively light in mathematics... ] -- .font150[ * ... but it is quite heavy in programming ] -- .font150[ * .orange[Programming can be hard and frustrating...] ] -- .font150[ * ... but it doesn't have to ] -- .font150[ * R has a steep learning curve, so practice is fundamental ] --- class: clear .center[] --- class: inverse, center, middle # Why programming? <html><div style='float:left'></div><hr color='#EB811B' size=1px width=720px></html> --- # Why programming? .center[] --- # Why programming? .font150[ * Nowadays, political science is mostly quantitative * Newspapers often use R to plot graphs and convey statistical information...and you can do it too ] --- background-image: url(sp.jpg) class: clear --- background-image: url(violencia.jpg) class: clear --- background-image: url(economist.png) class: clear --- background-image: url(policia.jpg) class: clear --- background-image: url(pcc.jpg) class: clear --- # Freire (2018) .center[] --- # Freire (2018) .center[] --- # Freire (2018) .center[] --- # Freire (2018) ```r dataprep.out <- dataprep(df, predictors = c("state.gdp.capita", "state.gdp.growth.percent", "population.projection.ln", "years.schooling.imp" ), special.predictors = list( list("homicide.rates", 1990:1998, "mean"), list("proportion.extreme.poverty", 1990:1998, "mean"), list("gini.imp", 1990:1998, "mean") ), predictors.op = "mean", dependent = "homicide.rates", unit.variable = "code", time.variable = "year", unit.names.variable = "state", treatment.identifier = 35, controls.identifier = c(11:17, 21:27, 31:33, 41:43, 50:53), time.predictors.prior = c(1990:1998), time.optimize.ssr = c(1990:1998), time.plot = c(1990:2009) ) ``` --- # Freire (2018) .center[] --- # Freire (2018) .center[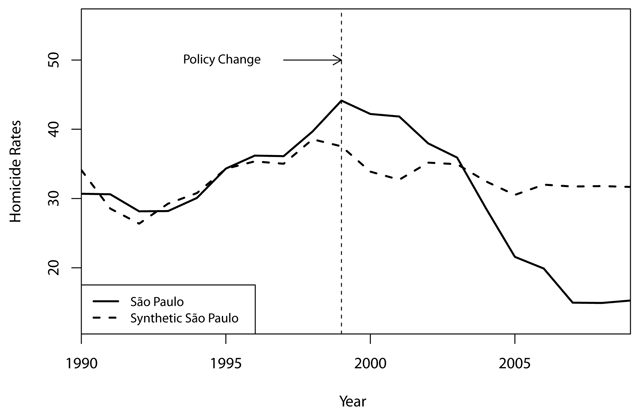] --- # Data visualisation in R .center[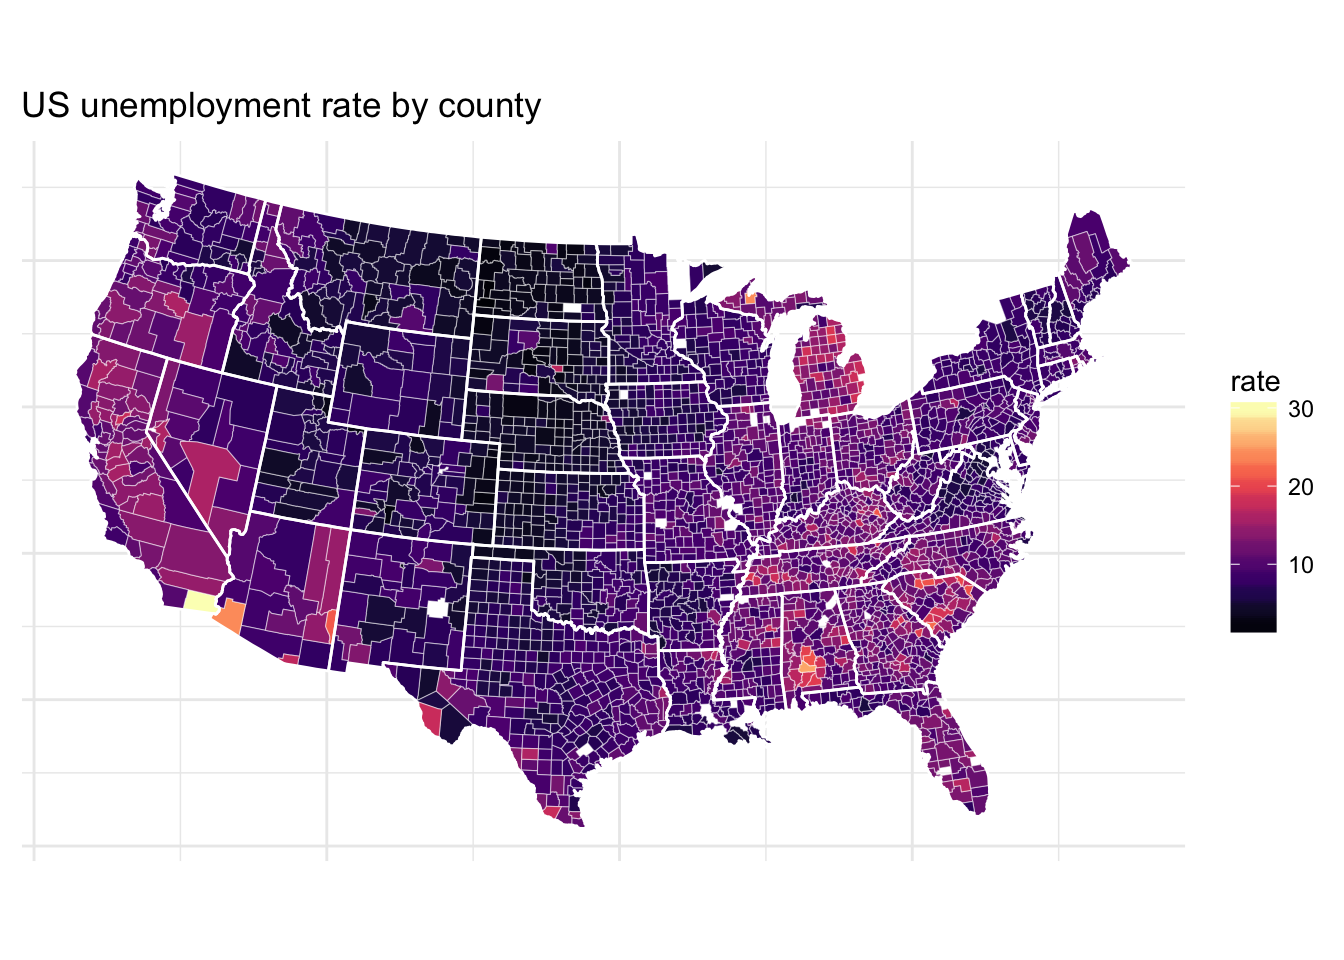] --- # Data visualisation in R .center[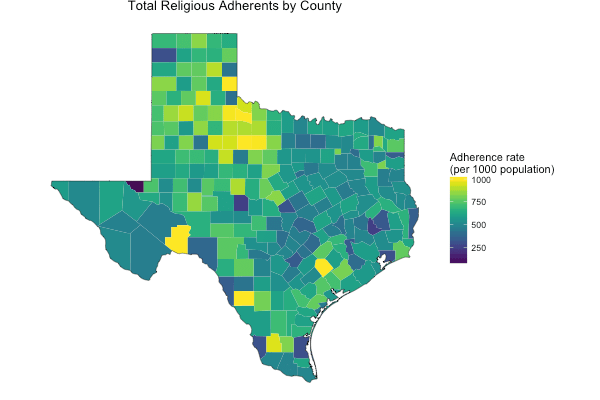] --- class: inverse, center, middle # Questions? <html><div style='float:left'></div><hr color='#EB811B' size=1px width=720px></html> --- # Homework .font150[ * Read chapter 1 of QSS * Download and install R and RStudio: * <https://cloud.r-project.org/> * <https://www.rstudio.com/> (RStudio Desktop, free version) ] --- class: inverse, center, middle # See you on Friday! <html><div style='float:left'></div><hr color='#EB811B' size=1px width=720px></html>